|
In this section, ITARDA's 2008 statistical study database is used to analyze the characteristics of single-vehicle accidents. (Vehicle types are according to the 2008 classification.)
1) Characteristics of single-vehicle accidents
(i) By vehicle type
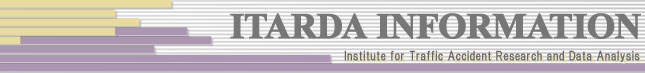
With respect to the type of vehicles (Fig. 4), single-vehicle accidents involving injuries and deaths are mainly caused by standard-sized passenger cars accounting for nearly 50%, followed by mini-sized passenger cars (25%) and light trucks (10%). A similar tendency is observed in other accident types.
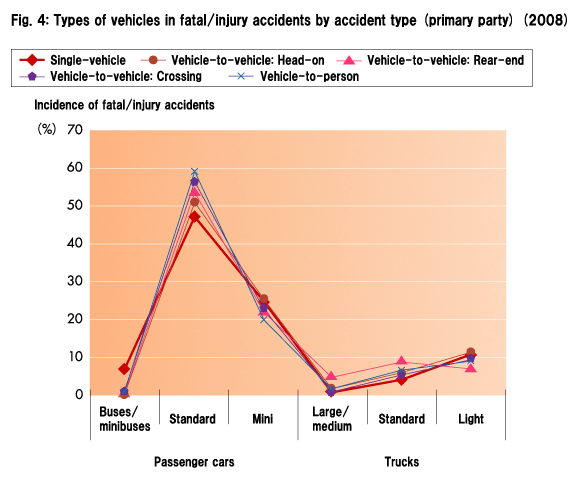
For only single-vehicle accidents involving deaths (Fig. 5), these three vehicle types also prevail in the same order (about 45%, 20% and 20%, respectively).
The share of each vehicle type in "Vehicle-to-vehicle rear-end collisions" differs between the fatal/injury accident group and the fatal accident group.
(ii) By vehicle type and road type
With respect to the type of roads, refer to Fig. 6 categorized by vehicle type. ("Other" road types include farm roads, forest roads, harbor roads, private roads and park roads.)
(iii) By vehicle type and party with which the car collided
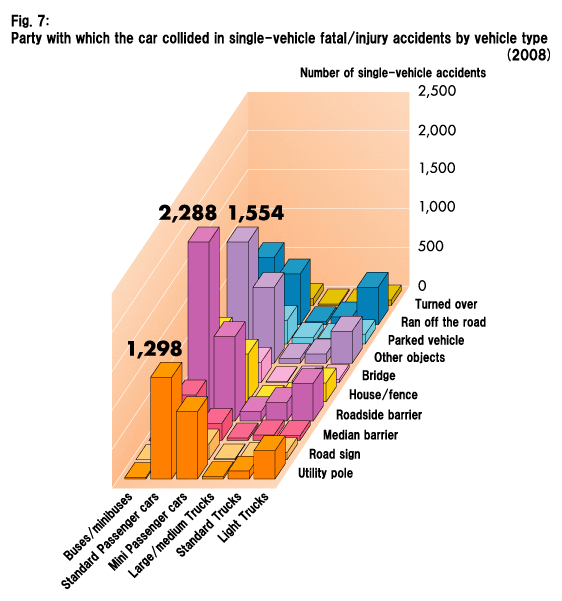
The type of structures/objects more prone to being crashed into in single-vehicle accidents involving injuries and deaths (Fig. 7) includes "roadside barriers" set up to prevent a vehicle from running off the road (2,288 cases by standard-sized passenger cars) and "utility poles" (1,298 cases by standard-sized passenger cars).
For only accidents involving deaths (Fig. 8), a similar tendency is observed. ("Other" objects include trees, stumps, roadside trees and ditches.)
|
|
|
|
|
|
|
|
|
|
|

|
|
|
|
|
|
|
|

|
|
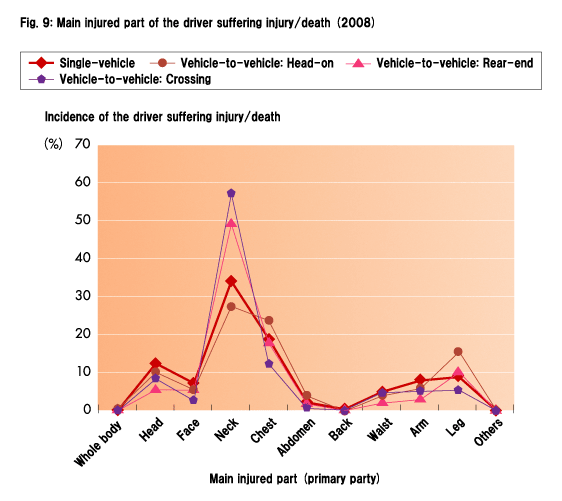
(iv) By main injured part
The typical injured parts of the driver in single-vehicle accidents are as follows:
- For accidents involving injuries and deaths (Fig. 9), the "Neck" and "Chest" particularly show high percentages as the main part of the body damaged. A similar tendency is observed in other accident types.
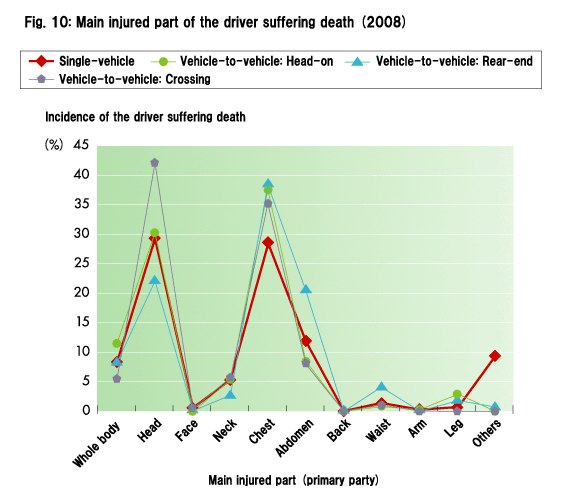
- For only accidents involving deaths (Fig. 10), the main injured parts are centered on the "Head" and "Chest".
A similar tendency is observed in other accident types, except for vehicle-to-vehicle rear-end collisions in which the "Abdomen" also has a fairly high risk of being harmed.
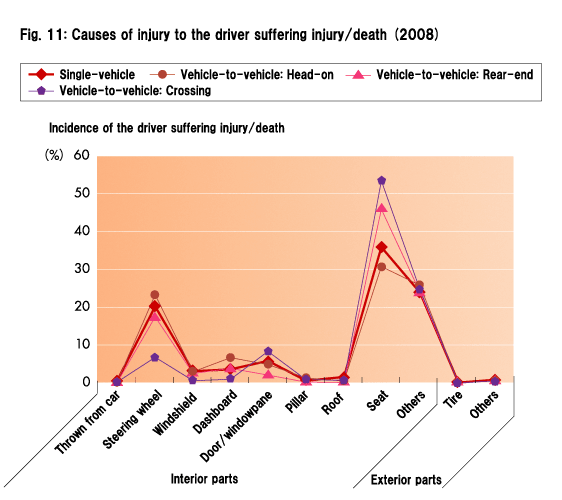
(v) By cause of injury
The causes of the driver's injury in single-vehicle accidents are as follows:
- For accidents involving injuries and deaths (Fig. 11), such interior parts as the "Steering wheel" and "Seat" are the two major sources of damage to the driver. A similar tendency is observed in other accident types.
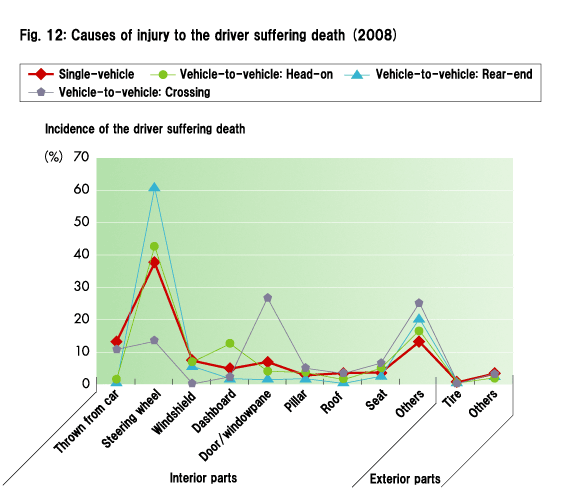
- For only accidents involving deaths (Fig. 12), the cause of injury is centered on the "Steering wheel".
A similar tendency is observed in other accident types, except for vehicle-to-vehicle crossing collisions where the "Door/windowpane" is another main contributing factor.
|
|
|
|
|
|
|
|
|
|
|
|
|
|
|
|
|
2) Detailed analysis
From among the above statistical data, factors causing more accidents are extracted and examined more closely.
- From the category "vehicle types", based on Figs. 4 and 5, standard-sized vehicles (excluding buses and minibuses) and mini-sized/light vehicles are selected.
- From the category "road types", as clearly shown in Fig. 6, highways and public roads are selected where the majority of single-vehicle accidents occur.
(i) Effect of road environment
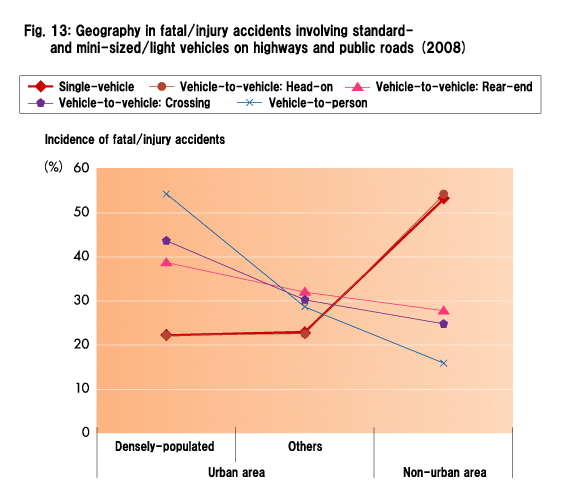
a) By geography
Unlike other accident types, the primary scene of single-vehicle accidents involving injuries and deaths (Fig. 13) is less densely populated "Non-urban areas" (54%).
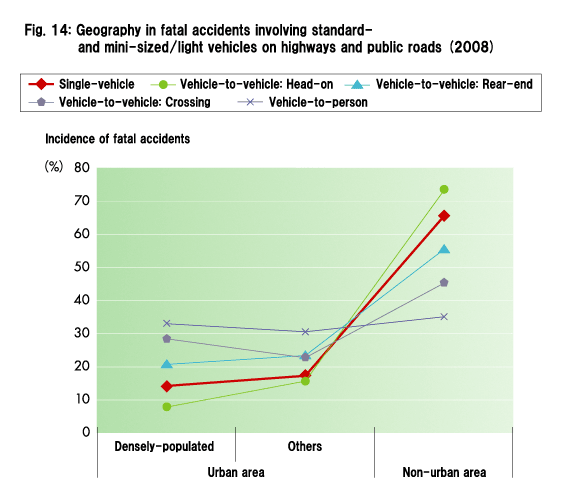
A similar tendency is observed for only accidents involving deaths (Fig. 14).
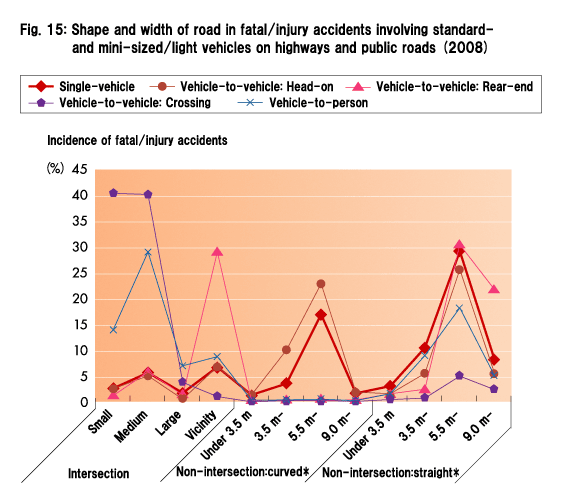
b) By shape and width of road
Accidents involving injuries and deaths occur more frequently in "Straight non-intersection locations: 5.5 m or wider" (29%) and "Curved non-intersection locations: 5.5 m or wider" (18%) (Fig. 15).
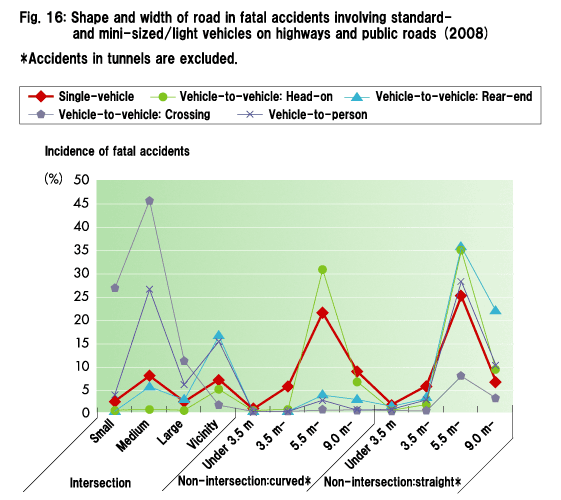
A similar tendency is observed for only accidents involving deaths (Fig. 16).
This suggests a higher probability of traffic accidents on a two-lane road, i.e., a road 5.5−9.0 m wide, and this tendency differs from other accident types.
|
|
|
|
|
|
|
|
|
|
|
|
|
|
|
|
|
(ii) Effect of driving behavior, and vehicle collision damage
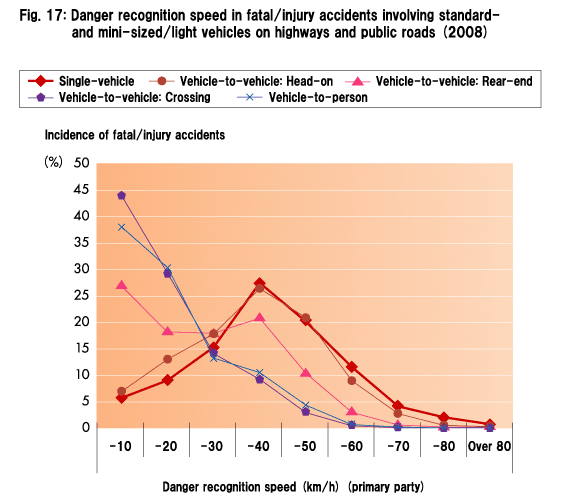
a) By danger recognition speed
The danger recognition speed at the time of single-vehicle accidents involving injuries and deaths (Fig. 17) tends to be higher, with 27% at "40 km/h or lower" and 21% at "50 km/h or lower", than that of the accident types
"crossing collisions", "vehicle-to-person collisions" and "rear-end collisions".
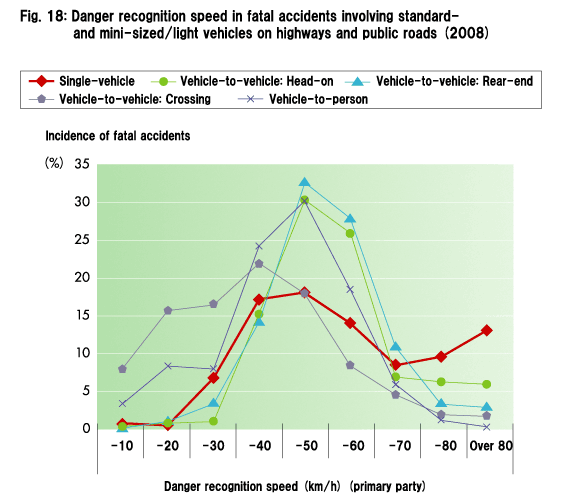
For only accidents involving deaths (Fig. 18), unlike other accidents types, higher speeds at "80 km/h or lower" and "over 80 km/h" constitute a relatively large part.
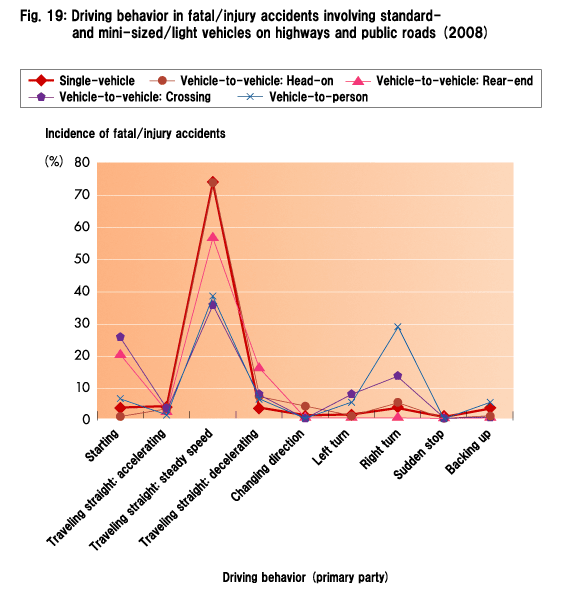
b) By driving behavior
The most characteristic state of driving at the time of single-vehicle accidents involving injuries and deaths (Fig. 19) is noticeably "Traveling straight at steady speed" (74%). This is also the case with rear-end and head-on collisions. Other characteristic states include "Starting" for crossing collisions and "Right turn" for vehicle-to-person collisions.
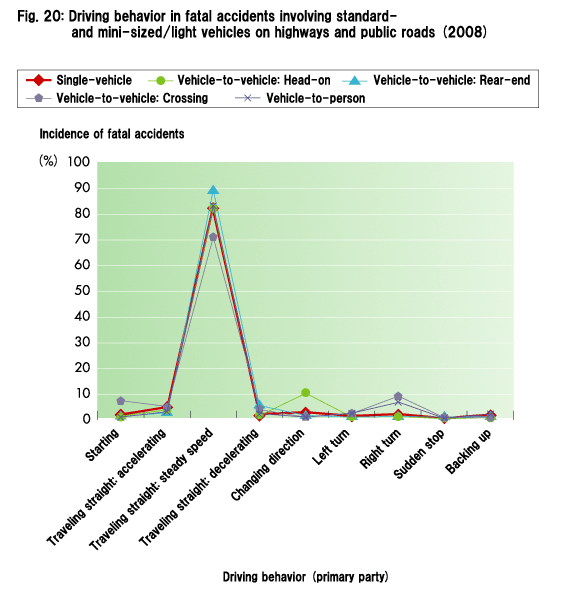
A similar tendency is observed for only accidents involving deaths (Fig. 20).
|
|
|
|
|
|
|
|
|
|
|
|
|
|
|
|
|
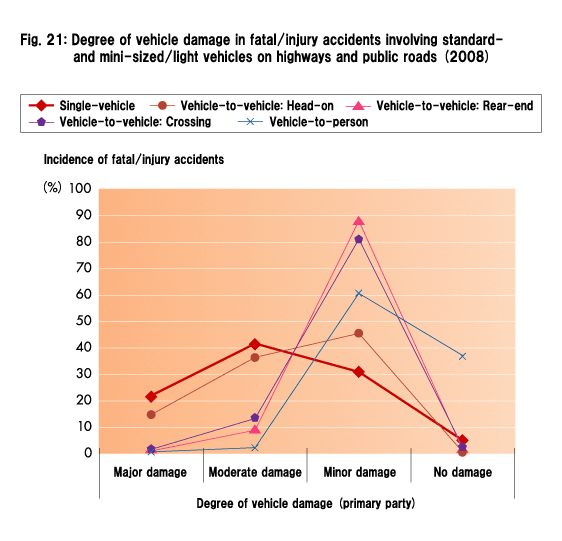
c) By vehicle collision damage
For single-vehicle accidents involving injuries and deaths (Fig. 21), the vehicles are more likely to receive "Moderate damage" (41%) or "Major damage" (21%) than in the case of rear-end, crossing and vehicle-to-person collisions.
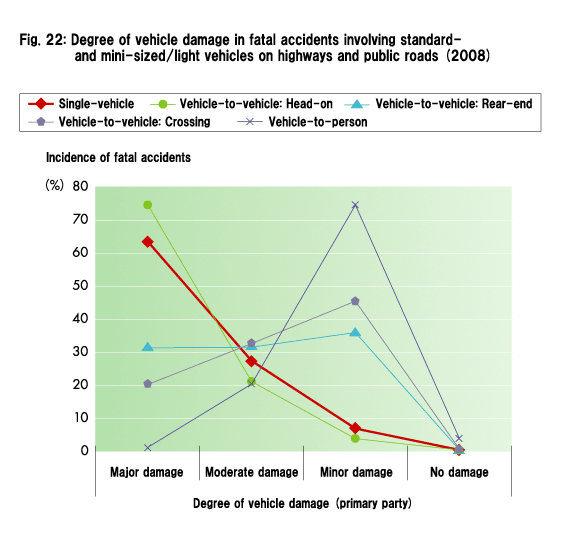
For only accidents involving deaths (Fig. 22), "Major damage" represents a considerably high percentage of 64%.
(iii) Effect of causative factors
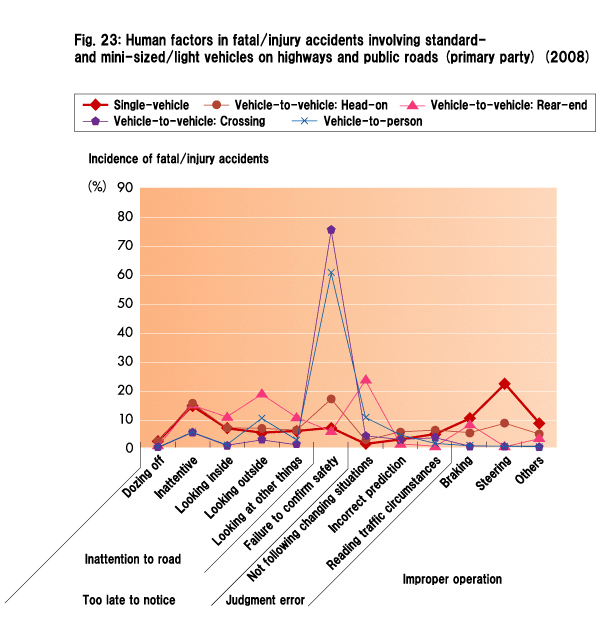
By human factor
For single-vehicle accidents involving injuries and deaths (Fig. 23), many of the contributing factors are found in the categories "Too late to notice" and "Improper operation". In the former category, "Inattention to road" due to being distracted or taking eyes off the road and "Failure to confirm safety" are frequently seen driver faults, and in the latter, "Improper steering" is the major cause of accidents.
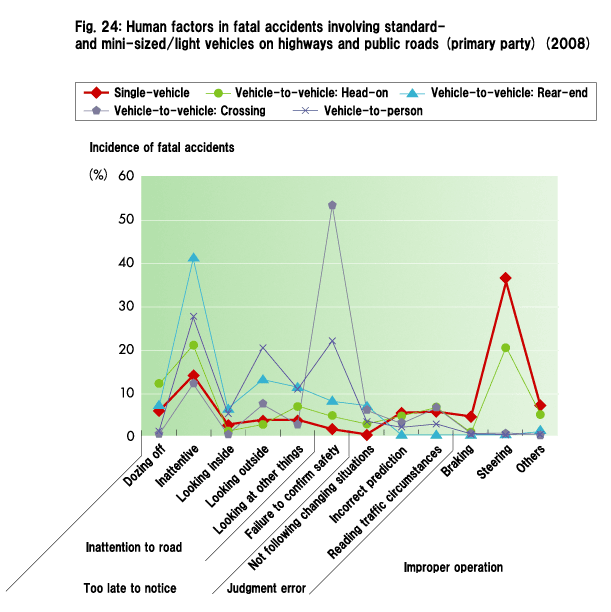
A similar tendency is observed for only accidents involving death (Fig. 24).
|
|
|
|
|
|
|
|
|
|
|
|
|
|
|
|
|
|
UP
Back Next
|