
|
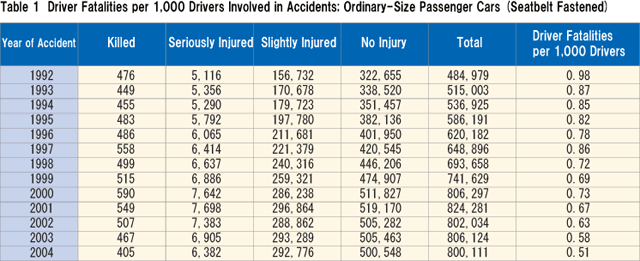
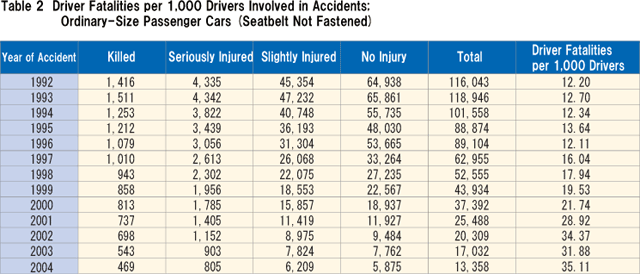
In Section 2, we observed driver fatalities per 100,000 cars for each year and confirmed that automobiles are becoming safer. Since the crash safety of cars presupposes the proper use of seatbelts, driver fatalities per 1,000 drivers involved in accidents were studied next, by the use and non-use of seatbelts (1992-2004). To calculate driver fatalities, we used the following formula:
|
|

|
|
| Analysis was conducted for ordinary-size passenger cars and light passenger cars. All accidents, not only frontal collisions, were analyzed. Other conditions are the same as in Section 2.
|
|
3-1 Ordinary-Size Passenger Cars
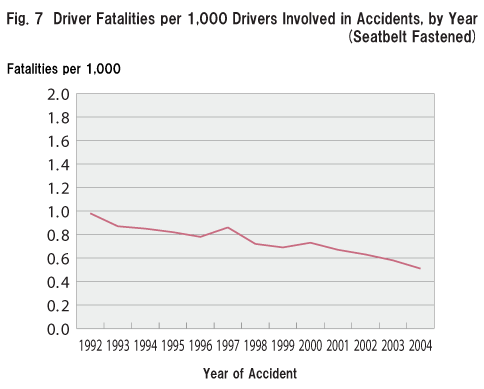
According to Fig. 7, driver fatalities per 1,000 drivers involved in accidents resulting in casualties, among those wearing seatbelts at the time of the accident, tend to decline each year, suggesting that the newer the cars are, the safer the cars tend to be as seen in Section 2.
|
|
|
|
|
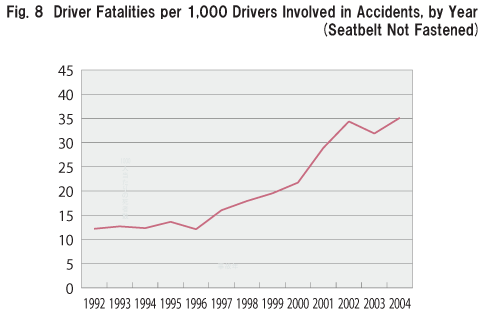
| Figure 8, on the other hand, shows that, among those who were not fastening their seatbelts, this indicator has been rising along with the year since 1997. The cause for this phenomenon is difficult to explain. It is probably due to the change in driving manners, the way people drive, and many other factors.
|
|
|
|
|
|
|
|
|
|
|
3-2 Light Passenger Cars
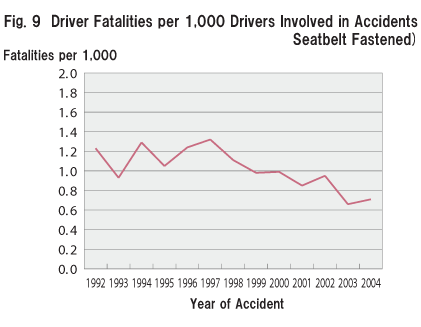
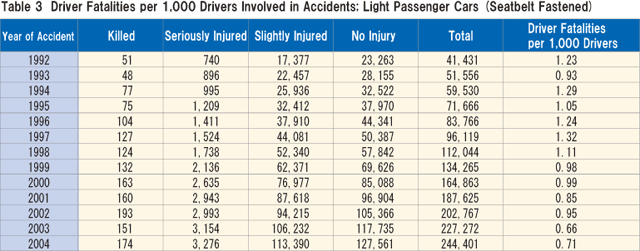
Figure 9 indicates that driver fatalities per 1,000 drivers involved in accidents resulting in casualties, among those wearing seatbelts, tend to decline each year, suggesting that the newer the cars are, the safer the cars tend to be as seen in Section 2.
|
|
|
|
|
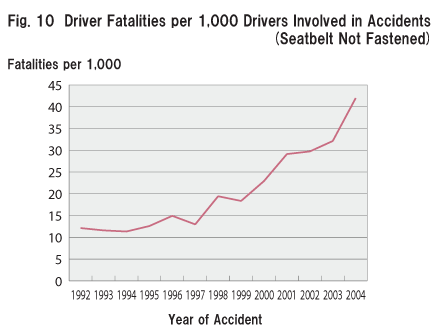
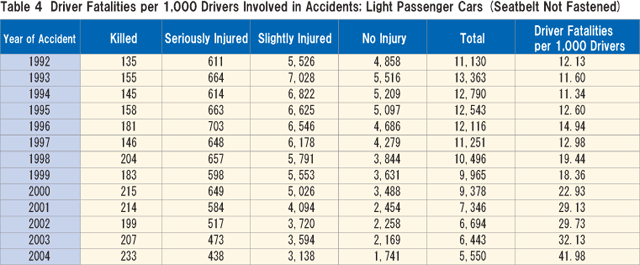
| Figure 10, on the other hand, shows that, among those who were not fastening their seatbelts, the indicator has been rising along with the year. This trend is the same as for ordinary-size passenger cars seen in Figs. 7 and 8.
|
|
|
|
|
|
|
|
|
|
|
UP
Back
|
