
|
(1) Percentage of Accidents by Road Configuration
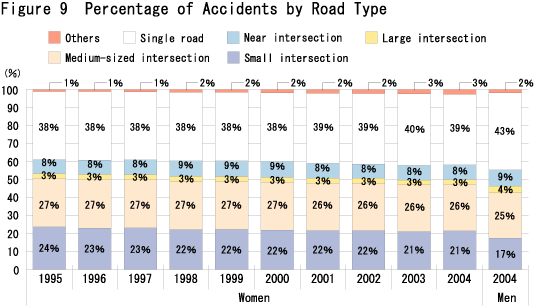
By road configuration, each item exhibits a similar trend (Figure 9). "Intersection (large, medium-sized, small)" and "near intersection" account for around 60% of all accidents, whereas "single road" took up about 40%. "Others" include railway crossings and other general traffic areas. This item, although small in number, is slowly on the rise.
A comparison between genders shows a higher ratio of "small intersection" for female drivers, and a smaller one at "single road". This indicates that women tend to have more accidents at intersections of narrow roads.
|
|
|
|
(2) Percentage of Accidents by Type of Vehicle
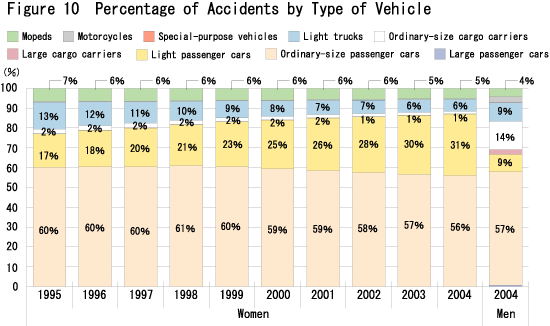
The ratio of "light passenger cars" widened significantly over the past decade, whereas that of "ordinary-size passenger cars", "light trucks", and "mopeds" shrunk (Figure 10). The number of accidents involving light passenger cars, many of which are popular with women drivers, is coming noticeably closer to the number for ordinary passenger cars.
Compared with men, while the percentage of accidents for light passengers cars is larger as shown above, the ratio is considerably smaller for large cargo carriers (including those defined by Cabinet Order), cargo carriers (ordinary-size and light), and motorcycles. Apparently, few women drive large-size vehicles (passenger cars and cargo carriers) or motorcycles.
|
|
|
|
(3) Percentage of Accidents by Day of the Week
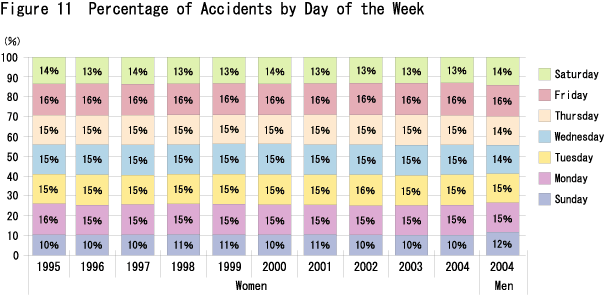
There is little noticeable annual change in each day of the week (Figure 11).
Compared with male drivers, the percentage of weekday accidents involving female drivers is approximately the same, whereas that of weekend accidents is slightly lower among women. This may indicate that women drive more often on weekdays than on weekends.
|
|
|
|
(4) Percentage of Accidents by Area of Residence
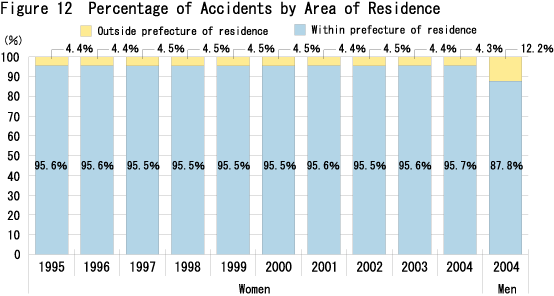
By residence, about 95% of all women's accidents occur in the prefecture where they live, with little annual change (Figure 12)
Compared with male drivers, female drivers show a higher ratio of accidents within the prefecture of residence, and a ratio lower outside. Women characteristically tend to have accidents near their home.
|
|
|
|
|
(5) Percentage of Accidents by Purpose of Drive
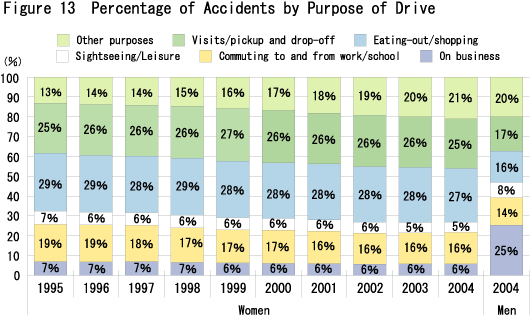
By purpose of drive, the percentage of "commuting to and from work/school" among women has been on the decline, whereas that of "other purposes" has widened. Approximately half the accidents involving female drivers are accounted for by driving for "eating-out/shopping" and "visits/pickup and drop-off" (Figure 13).
A comparison shows that while 25% of men's accidents occur while driving on business, the ratio is only 6% for women. As seen in the higher percentage of "eating-out/shopping" and "visits/pickup and drop-off", more women have accidents while driving for personal purposes. "Other purposes" include leisure activity, transporting things, attending lecture/class, to and from hospital/clinic, homecoming, etc.
|
|
|
|
(6) Percentage of Accidents by Error
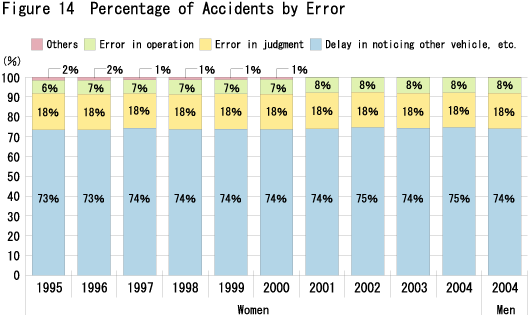
By type of errors, the percentage of "delay in noticing other vehicle, etc." and "error in judgment" have remained more or less the same, while that of "error in operation" widened slightly and that of "others" narrowed somewhat (Figure 14).
A comparison between genders exhibited little difference, with "delay in noticing other vehicle, etc.", "error in judgment", and "error in operation" registering similar percentages between male and female drivers. In both genders, about 70% of accidents were caused by "delay in noticing other vehicle, etc."
|
|
|
|
|
|
UP
Next
|
