|
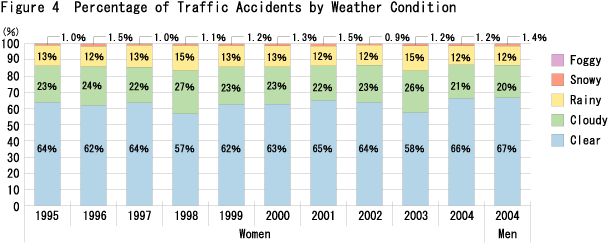
(1) Percentage of Accidents by Weather Condition
Examining the weather conditions under which female drivers had accidents, "clear" and "cloudy" accounted for 80% when combined (Figure 4). "Snowy" took up a minimal 1%, but is nevertheless slowly on the rise.
Compared with male drivers, there were no remarkable difference in ratios: men and women have accidents under "clear", "cloudy", "rainy", "foggy", and "snowy" conditions in similar proportions. |
|
|
|
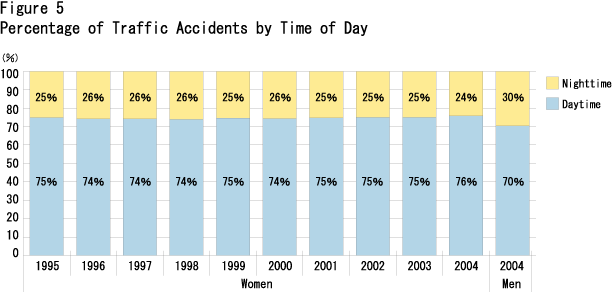
(2) Percentage of Traffic Accidents by Time of Day
About 75% of traffic accidents, or three out of four cases, occur during the daytime (Figure 5).
The proportion of daytime/nighttime accidents remains approximately the same in each year.
The ratio of daytime accidents is slightly larger among female drivers than male drivers, indicating that women tend to drive more often during the daytime than men.
|
|
|
|
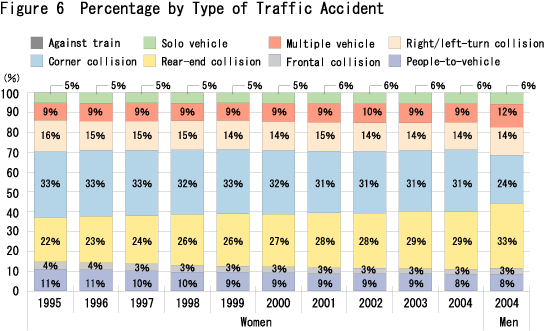
(3) Percentage by Type of Traffic Accident
Corner collisions account for the largest share at approximately 30% of all accidents (Figure 6). This is followed by rear-end collisions, which have increased about 7% over the past decade. Corner collisions and people-to-vehicle accidents have fallen 2-3% during the same period.
Among female drivers, corner collisions take up the largest portion, 31%, followed by rear-end collisions at 29%. These two accident types differed in their share by more than 10 percentage points a decade ago, but are now almost equal as the ratio of rear-end collisions crept up by 7% over the period. If this tendency continues, the ratio of rear-end collisions by female drivers could come close to the 33% for male drivers, among whom rear-end collisions account for the largest segment.
|
|
|
|
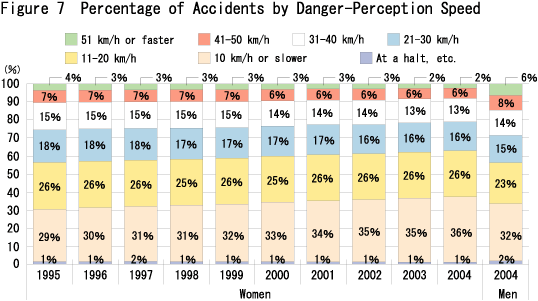
(4) Percentage of Accidents by Danger-Perception Speed
Danger-perception speed is the speed of a vehicle (a moped or larger-engine vehicle) at which the driver is alert to another vehicle, pedestrian, object, etc. Over the last 10 years, the percentage of accidents in which drivers spotted danger while traveling "51 km/h or faster" decreased, whereas the ratio of accidents in which the danger-perception speed was "10 km/h or slower" increased remarkably from 29% to 36% (Figure 7).
Compared with male drivers, women tend to be alert at a slower speed: the ratio of "10 km/h or slower" and "20 km/h or slower" was higher for women than men while the percentage of "50 km/h or slower" and "51 km/h or faster" was apparently lower. This indicates that women are inclined to drive more slowly than men.
|
|
|
|
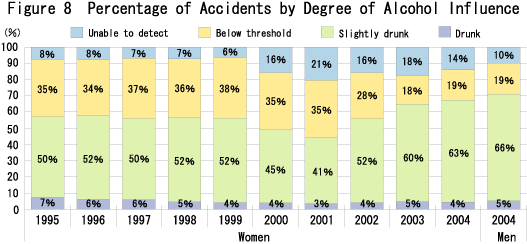
(5) Percentage of Accidents by Degree of Alcohol Influence
For degree of alcohol influence, "slightly drunk" means the level set forth by Cabinet Order (0.25 mg alcohol per liter of exhaled air till May 2002, and 0.15 mg from June 2002) or above, while "below threshold" means under this level.
For women drivers who were under the influence of alcohol when had an accident, the percentage of those who were "drunk" and "slightly drunk" fell in 2000 and 2001, and then turned upward again. The percentage of those "unable to detect" increased substantially in 2001 (Figure 8). The sharp decline in the ratio of "below threshold" was probably due to the stricter drunk-driving regulations in June 2002.
Compared with male drivers, women exhibit a somewhat lower ratio of "drunk" and "slightly drunk", and a higher percentage of "unable to detect". Even under the influence of alcohol at the time of accident, the degree of intoxication seems to be lower among female drivers.
|
|
|
|
|
UP
Next
|