 |
||||
|
|||||||
 26 of the approximately 7,700 accidents involving injury and death in the year 2000 in Japan were caused by wrong-way driving. Although the percentage of wrong-way accidents is low, they have a high fatality rate and should be considered by society to be one of the more serious forms of traffic accidents. |
| 1. Wrong-way accidents involving injury and death This study examines the occurrence of wrong-way accidents on highways. Fig. 1 shows traffic accident statistics on the numbers of wrong-way accidents and total accidents involving injury and death that occur on highways. Accidents involving injury and death have increased yearly, and in particular, by 1.4 times from 1990 to 2000. Among these, wrong-way accidents have increased by 4 times, a high rate of growth compared to the whole. Fig. 2 shows Fatality rate (the percentage of accidents that end in one or more fatalities). In 2000, as many as 11.8% of wrong-way accidents ended in a death, but only 2.0% of the total number of accidents ended in someone's death. |
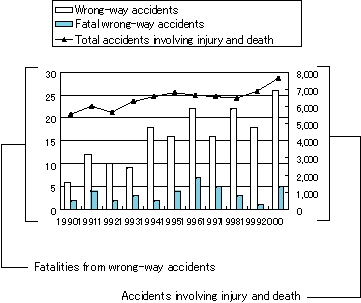 Fig. 1 Wrong-way accidents 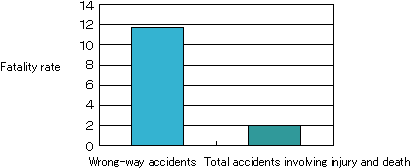 Fig. 2 Fatality rate (%) |
 What exactly is involved in a wrong-way accident? This study examined and analyzed the data from 124 wrong-way accidents, including those that involved a loss of property, that occurred in the 4 years from 1997 to 2000. |
| 2.1 Accidents according to age range What are the characteristics of wrong-way accidents by the age and gender of the driver(s)? The graph in Fig. 3 shows the number of accidents by age range. The numbers peak in three age ranges - 25-29, 45-54, and 75-79 years old. The overwhelming majority of wrong-way accidents involved male drivers. Most of the female drivers were in the young age range. The graph in Fig. 4 shows the percentages of accidents by age range. The percentage of senior citizens involved in the total number of accidents on highways involving injury or death is only 4%, but as many as 29% of the wrong-way accidents on highways were caused by those in the senior citizens age range. |
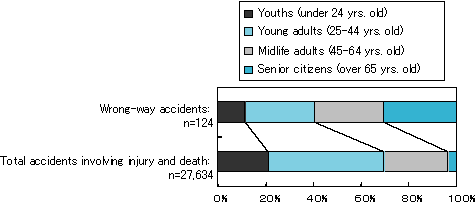 Fig. 3 Accidents by age range 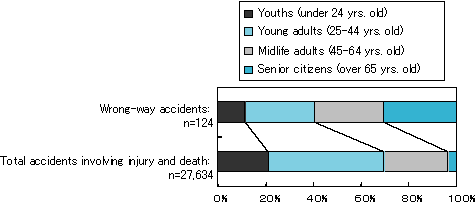 Fig. 4 Percentages by age range |
| 2.2 Accidents according to month The graph in Fig. 5 shows the number of accidents by month. A great number of wrong-way accidents are caused by senior citizens in the early spring months of March and April. According to the section 3.2 "Circumstances involved in wrong-way driving" on page 4, most occur in early spring and involve senior citizens with some kind of physical illness such as dementia. In the other age ranges, many accidents occurred in December and were brought about by drunk driving (DUI). |
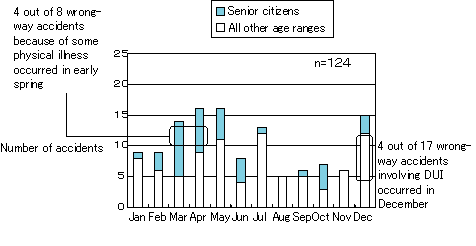 Fig. 5 Accidents by month |
| 2.3 Accidents according to time of day The graph in Fig. 6 shows the number of accidents by time of day. Most accidents involving senior citizens occurred during the daytime, and most accidents involving people in the other age ranges occurred during the nighttime. Specifically, all wrong-way accidents caused by DUI occurred during the time period from 7 p.m. to 7 a.m. |
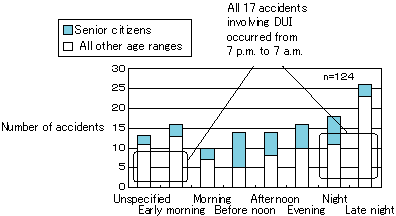 Fig. 6 Accidents by time of day |
| up |
Institute for Traffic Accident Research and Data Analysis (ITARDA) |