 |
| 1. Analysis of accidents due to inadequate maintenance constituting a legal violation by the driver |
1-1. Statistics and legal violations in vehicle first party accidents due to inadequate maintenance
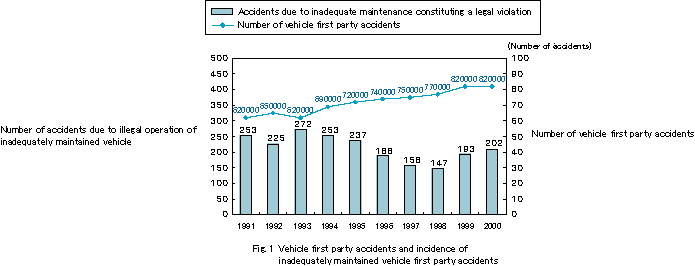
Since 1991, when there were 620,000 vehicle first party accidents, the trend has been on the increase. Although
the rate of increase slowed after 1999, there were still 820,000 such accidents in the year 2000 (Fig. 1).
The number of accidents due to inadequate maintenance peaked at 272 in 1993, decreased thereafter, but turned around
again in 1999 and totaled 202 in the year 2000 (0.02% of the total 820,000 vehicle first party accidents). |
|
| 1-2 Percentage of Accidents Involving Violations of Maintenance Laws by Accident Party Type (in 2000) |
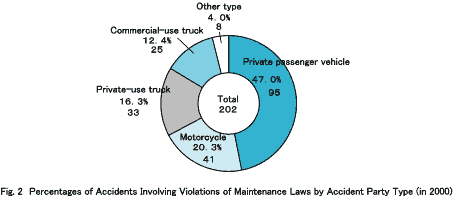
| Of the 202 accidents in 2000 where the first party was an inadequately maintained vehicle, 95, or approximately 50%,
involved private passenger vehicles, 41, or 20%, involved motorcycle, and 25, or 10%, involved commercial-use
trucks. (Fig. 2) |
|
| 1-3 Changes in the Number of Fatal Accidents Involving Violations of Maintenance Laws |
| Of the 35 fatal accidents in the ten years from 1991 to 2000 involving violations of maintenance laws, 19, or 50% of the
total, were caused by inadequately maintained transport vehicles.(Fig. 3) |

|
UP
|
| 2. Analysis of vehicle first party accidents by types of inadequate maintenance |
| 2-1 Numbers of vehicle first party accidents by types of inadequate maintenance (1996 - 2000) |
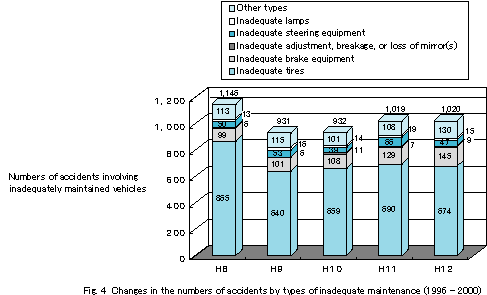
| The number of accidents due to inadequate maintenance peaked at 1,146 in 1996, decreased over the past 5
years, but turned around in 1999 and totaled 1,020 in the year 2000 (Fig. 4).
No changes were registered during the five years with regard to accidents caused by tire inadequacy and brake
equipment inadequacy, the former causing 70% and the latter causing 10% of the total accidents. |
|
| 2-2 Numbers of accidents by types of inadequate maintenance and accident type (2000) |
In the year 2000, 69.0%, or 704, of the accidents were between vehicles and 24.0%, or 250, accidents were single-vehicle
accidents. (Table 1) Tire inadequacy was the cause of 674, or 70% of the 1,020 accidents.
Of the 674 accidents due to tire inadequacy, 80%, or 429, were caused by using summer tires on snowy roads, and 85
were caused by tread wear. In all incidents, the drivers had accidents because they could not maintain control on icy or
slippery roads. |
Chart 1 Numbers of Accidents Involving Inadequate Maintenance (2000)
| | Person/Vehicle | Vehicle/Vehicle | Single-Vehicle | RR Crossing | Total |
| Inadequate brake equipment | 9 | 115 | 21 | 0 | 145 |
| Inadequate steering equipment | 3 | 34 | 10 | 0 | 47 |
| Inadequate tires | 25 | 452 | 197 | 0 | 674 |
| Inadequate wheels | 3 | 16 | 0 | 0 | 19 |
| Inadequate lamps | 4 | 10 | 1 | 0 | 15 |
| Engine breakdown | 1 | 6 | 1 | 0 | 8 |
| Inadequate or broken transmission | 0 | 2 | 1 | 0 | 3 |
| Inadequate fuel, oil equipment | 0 | 1 | 1 | 0 | 2 |
| Inadequate windshield and other window glass | 10 | 16 | 0 | 0 | 26 |
| Inadequate adjustment, breakage, or loss of mirror | 2 | 5 | 2 | 0 | 9 |
| Inappropriate remodeling (fenders, etc.) | 0 | 6 | 1 | 1 | 8 |
| Other inadequate structure, equipment adjustments | 8 | 41 | 15 | 0 | 64 |
| Total | 65 | 704 | 250 | 1 | 1,020 |
|
| 2-3 Numbers of Accidents by Types of Vehicles and Maintenance Inadequacy (2000) |
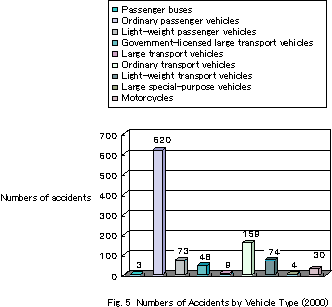
| Looking at the accidents by the types of vehicles involved, we see that 620 (60.8%) involved ordinary passenger
vehicles, 159 (15.6%) involved ordinary transport vehicles, 74 (7.2%) involved light transport vehicles, and 73 (7.2%)
involved light passenger vehicles. (Fig. 5) |
|
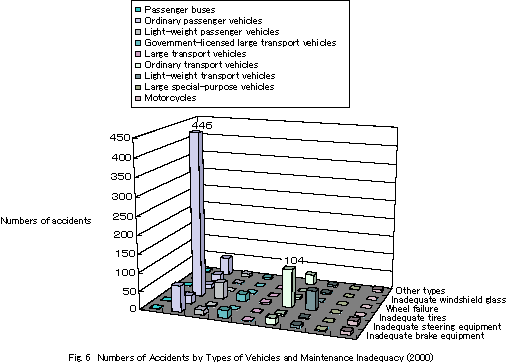
| Looking at Figure 6, we see that tire inadequacy of ordinary passenger vehicles accounted for 446, or 43.7% of the total
accidents, while 104, or 10.2% were caused by tire inadequacy of ordinary transport vehicles. In both cases, tire
inadequacy was the outstanding factor. |
|
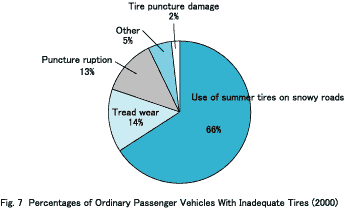
| Of the 446 accidents caused by tire inadequacy of ordinary passenger vehicles, 294, or 70%, were brought about by
the use of summer tires on snowy roads.(Fig. 7) |
|
| UP |


