|
-Collisions with guard fences cause lower driver fatality rates-
Various kinds of structures are installed on roads and roadsides, and each has a unique function. For example, guard fences, dividers, signposts, traffic lights and street lamps are traffic safety facilities that ensure safe and smooth flow of traffic. Utility poles are essential for daily life and thus are installed on roads or private land with the permission of the road administrator or landowner. We can see fences and houses, and shops and other commercial constructions on roadsides.
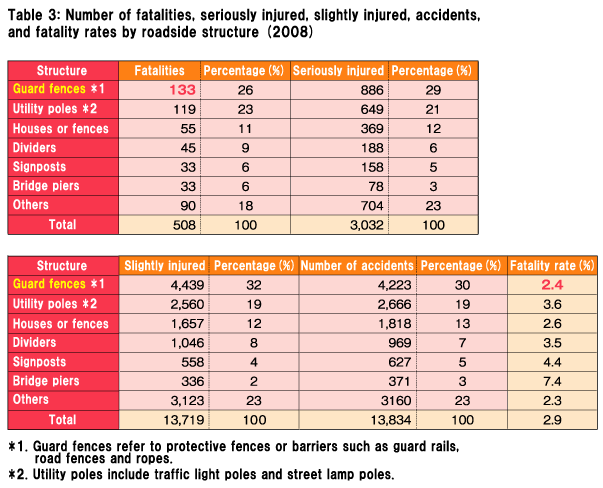
For each of these structures, the number of fatalities, seriously injured, slightly injured, accidents, and the fatality rates are shown in Table 3 for all car occupants involved in collisions.
Looking at guard fences, the number of deaths (133) is higher than that for any other structures. This structure also caused 886 and 4,439 occupants to suffer serious injury and slight injury, respectively, and was the object most frequently hit by cars in 4,223 accidents, with each of these figures accounting for around 30% of each category.
This noticeably large number of casualties and high incidence related to guard fences may be attributed to the fact that guard rails and other guard fences, if installed, are the first structure to be hit by a car running off the road.
If guard fences are not installed, then a car running off the road is most likely to crash into a divider, signpost, or bridge pier. Furthermore, if none of these structures are around, the car may crash into a utility pole, run onto a sidewalk and hit a pedestrian, run onto private land and crash into a fence or a house, or even fall off a cliff if driving on a mountain road.
Despite the large number of casualties and high incidence, however, collisions with guard fences have a fairly low occupant fatality rate (2.4%) compared with that of other structures. Below, we will examine the occupant fatality rates for each structure.
|
|
|
|
|
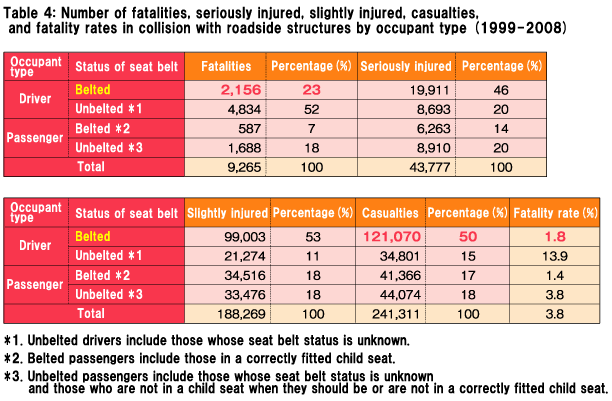
For this examination, we limited the data to accidents occurring in the 10-year period between 1999 and 2008 caused by standard- and mini-sized passenger cars and standard-sized and light trucks crashing into roadside structures.
The number of fatalities, seriously injured, slightly injured, casualties, and fatality rates are shown in Table 4 by occupant type and status of seat belt.
For drivers wearing a seat belt, the statistics show 2,156 deaths (23% of the total), 121,070 casualties (50% of the total) and a 1.8% fatality rate. For drivers without a seat belt, on the other hand, there were 4,834 deaths (52% of the total) and a fatality rate of 13.9%, showing a sevenfold increase compared to when drivers are belted. The same is true for passengers, with more than a twofold difference in the fatality rates depending on the wearing of seat belts.
It is clear that, as in all other types of accident, the seat belt plays an important role in reducing injury in collisions with roadside structures.
In the following examination, we will focus exclusively on drivers wearing a seat belt to clarify the relationship between structures and the occupant fatality rates.
|
|
|
|
|
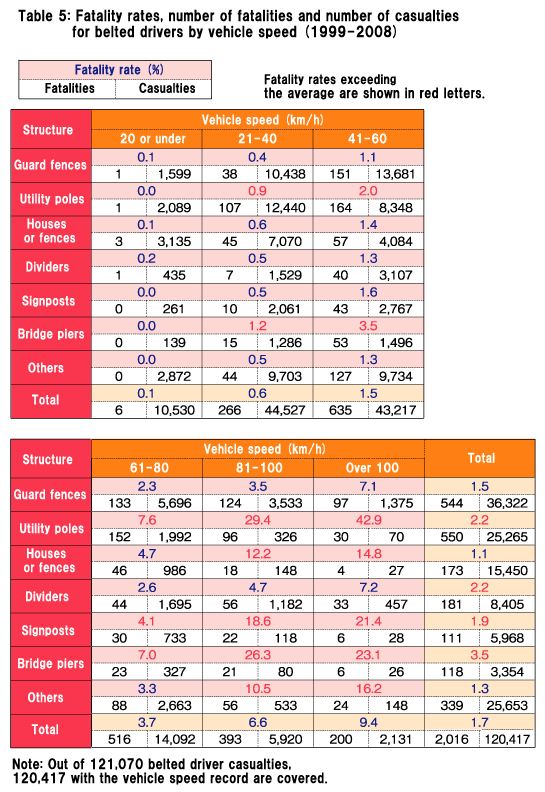
Firstly, to discuss the effect of vehicle speed* at the time of collision, the fatality rates, the number of fatalities and the number of casualties are shown for belted drivers by vehicle speed (Table 5).
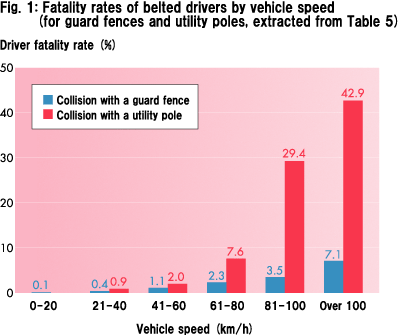
The numbers reveal that the fatality rates for collisions with guard fences and dividers do not increase as sharply as with other structures even at higher vehicle speeds, with all the rates falling below 10%. As seen in Fig. 1, the fatality rate rises about threefold from 1.1% at 41-60 km/h to 3.5% at 81-100 km/h and about sevenfold to 7.1% at over 100 km/h in collisions with guard fences, whereas in the case of utility poles the rate jumps fifteenfold from 2.0% at 41-60 km/h to 29.4% at 81-100 km/h and more than twentyfold to 42.9% at over 100 km/h. In other words, there is a clear difference in the injury suffered by the driver between collisions with guard fences or dividers and those with other structures even at the same speed. The difference is particularly remarkable in higher speed ranges.
Guard fences are less fatal in crashes than other structures because these traffic safety facilities are installed to prevent a vehicle turning in the wrong direction from running onto the roadside, the opposite lane or a sidewalk, as well as to minimize injury to the occupants and damage to the vehicle body so as to return to the right direction. Guard fences are subject to vehicle crash tests with specified values for lane departure prevention performance and impact on the vehicle (deceleration) to ensure the safety of occupants, which as a whole contributes to the low fatality rates.
* "Vehicle speed" is the speed when the driver recognizes the imminent danger of an accident. More specifically, the speed immediately before the driver attempts to avoid an accident by braking, steering, etc.
|
|
|
|
|
|
|
|
|