|
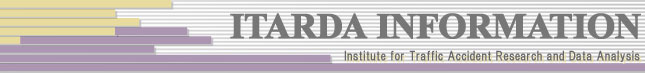
Crossing collisions are considered to be caused more often by senior drivers who have difficulty handling
a complicated flow of traffic at an intersection. Since four-wheeled vehicles are more likely to be the primary party in a collision with a motorcycle or bicycle regardless of the situation, shown here is the incidence of crossing collisions caused by male drivers of standard- and mini-sized passenger cars as the primary party colliding with a four-wheeled vehicle (Fig. 8). Basically, aging increases the risk of causing a collision in every accident year, and here again we can see the age at which this increase starts shifting to older age groups in line with the passing of the accident year; whereas the increase starts at 25-29 in the accident year 1984-1988, the beginning of a gradual rise is observed at 40-44 in the accident year 2004-2008. As there is a series of shifts to older age groups over time, we can say that the incidence of crossing collisions reflects a generation-specific factor. If the shift of the generation at which the increase starts reflects their generation-specific characteristics, then the generations that are older must shift in a similar generation-dependent manner, not just because of their weakened physical ability. The reason why drivers from these older generations were more frequently involved in accidents as time goes back is considered to be the combined effect of their generation-specific factors and aging.
Looking at the graph more closely, there is a sharp rise between the age groups 55-59 and 60-64 in every accident year, suggesting that aging considerably affects drivers of those ages. However, the number of primary parties starts to rise at the age of 40-44 in the accident year 2004-2008, one age group earlier than expected, since drivers 25-29 years old in 1984-1988, the generation with a large population, were 45-49 in 2004-2008. This is probably because aging starts to take effect at around the age of 40. To sum up, drivers who are now over 45 have a higher probability of being involved in a crossing collision due to the combined effect of aging and their generation-specific factors.
Driving behavior (traffic offenses) causing collisions
|
|
|
|
|
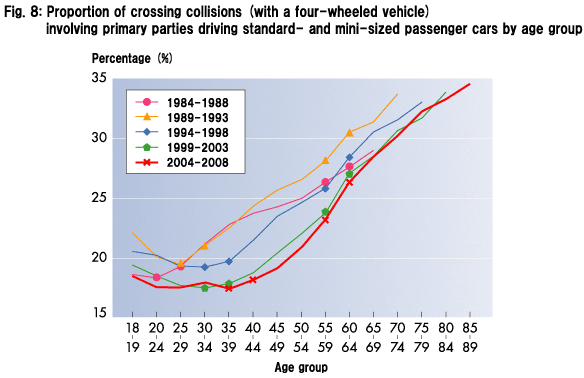
The main traffic offense causing crossing collisions was previously "failure to stop, etc. at the designated place" (hereafter "stop sign violation"), followed by "red light violation". On the other hand, "failure to confirm safety" started increasing around 1988, became the dominant cause in 2002, and is still rising. However, this offense can be seen in every type of accident and therefore only the first two offenses, which are more likely to result in crossing collisions, are discussed here.
Figure 9 shows the frequency of a stop sign violation causing a collision with a four-wheeled vehicle only, for the reason explained above. Here again, the age at which the percentage turns to an increase shifts to older age groups as time passes. There is also a sharp rise, although slightly different for each accident year, between the ages 55-59 and 60-64. From this, we can say that the increase in stop sign violation reflects the effect of both aging and
generation-specific factors.
|
|
|
|
|
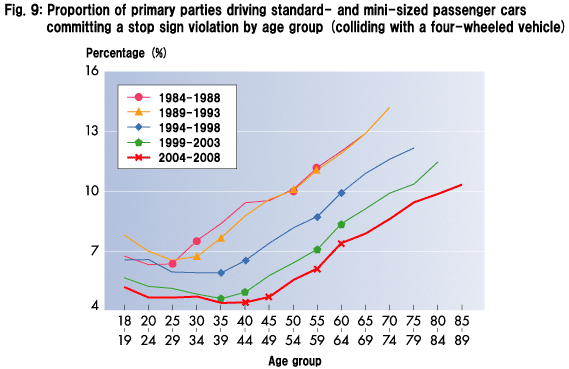
As for red light violation (Fig. 10), all lines for different accident years have approximately the same pot-like shape. With the age groups 25-44 at the bottom, the frequency of a red light violation rises for younger and older age groups, clearly reflecting the effect of aging.
From these observations, it can be concluded that crossing collisions are influenced by generation-specific factors because the driving behavior "stop sign violation", which so often causes crossing collisions, is influenced by the same factors.
|
|
|
|
|