|
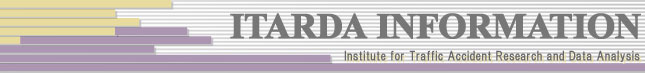
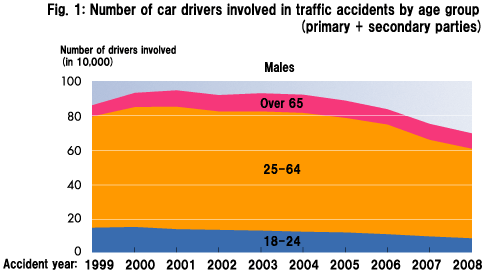
Figures 1 and 2 show the number and the percentage of car drivers directly involved in traffic accidents (primary + secondary parties) by age group and gender in the past ten years. Males have approximately doubled in number every year compared to females, although the difference has gradually become smaller. There has also been a general downward trend in the total number for both males and females over the last few years.
|
|
|
|
|
|
|
|
|
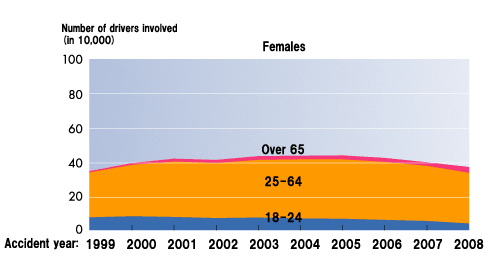
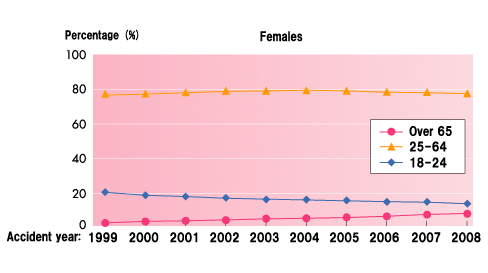
We can see in Fig. 2 that there is a steady increase in elderly drivers (over 65) and a steady decline in younger drivers (18-24) for both males and females, a trend attributed to aging population and falling birth rate and likely to continue in the future. Elderly male drivers are always more likely to be involved in an accident than their female counterpart, and were more likely than their younger counterpart in 2008.
|
|
|
|
|
|
|
|
|
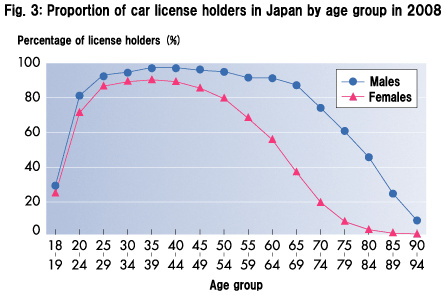
Looking at the share of the population holding a driver's license for four-wheeled vehicles (hereafter "license") for each age group in 2008, as shown in Fig. 3, it is clear that many more males have a license than females for older age groups, which is considered to be a major reason why elderly drivers account for a relatively large proportion of accidents involving males.
|
|
|
|
|
The ratio of female license holders goes up in younger age groups, with the age group 35-39 at the peak, approaching that of males. The gap in number between male senior drivers and female senior drivers is therefore estimated to become narrower in the long term.
|
|
|
Next
|