When and where do collisions in the low speed range occur? (Note that the data used in the following sections is the total of the five-year accident statistics between 2002 and 2006 to ensure sufficient data for analysis.)
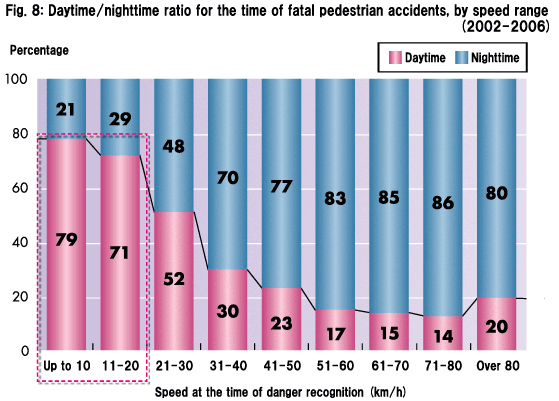
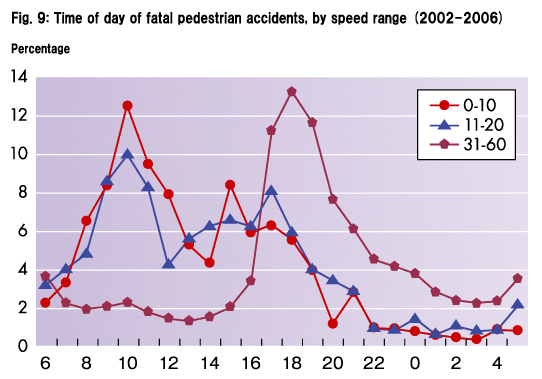
Figure 8 classifies the number of fatal collisions into two broad categories, "Daytime" and "Nighttime," in percentage according to the time when the accident occurred, by speed range. Daytime accidents constitute about 70 to 80% for the low speed range. Looking more closely at the time of day, as shown in Fig. 9, we can see frequent occurrence of low-speed collisions in the morning, with the peak between 10 and 11 o'clock. This is presumably because traffic at this hour is crowded with commuters, schoolchildren and shoppers who are more likely to be hit by cars driving slowly.
|
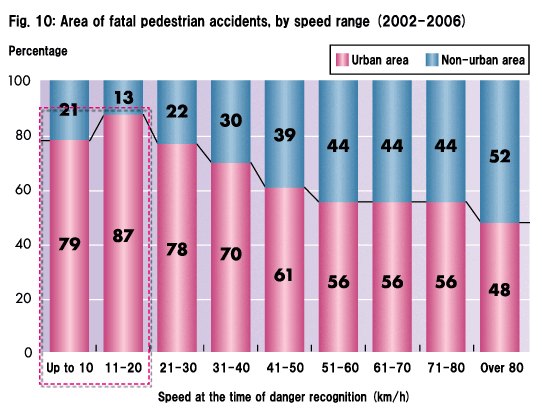
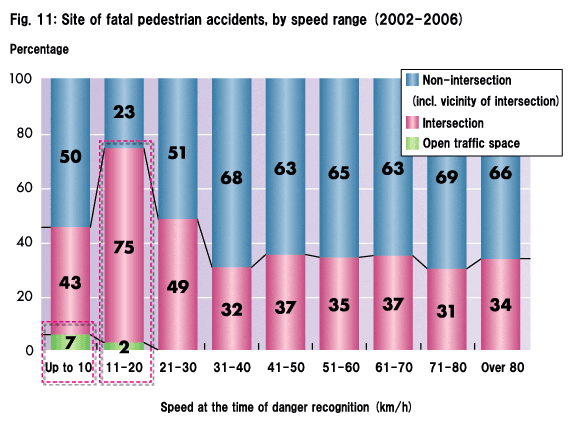
Figure 10 categorizes the number of fatal collisions in terms of the accident site as "Urban area" and "Non-urban area" in percentage, by speed range. It is clearly shown that accidents tend to occur in urban areas when the collision speed is low. Urban accidents for the low speed range account for about 80 to 90%. Figure 11 summarizes the percentage of fatal collisions happening on three different types of road, by speed range. There is a noticeable difference in the composition between the speed range of 10 km/h or lower and that of 11−20 km/h. For the speed range of up to 10 km/h, accidents occurring in open traffic spaces such as large parking lots and service areas on freeways represent the highest percentage at 7%, whereas the speed range of 11−20 km/h is characterized by accidents occurring at intersections representing more than 70%, the highest among all the speed ranges.
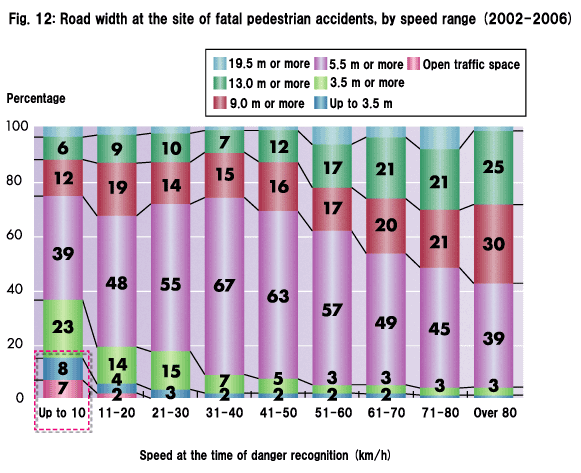
The percentages of fatal collisions are shown in Fig. 12 classified according to the width of the road, by speed range. The major site of accidents is relatively narrow roads and open traffic spaces for the speed range up to 10 km/h, and relatively wide roads for the speed range 11−20 km/h.
|