 |
−Bicycle riders as victims−
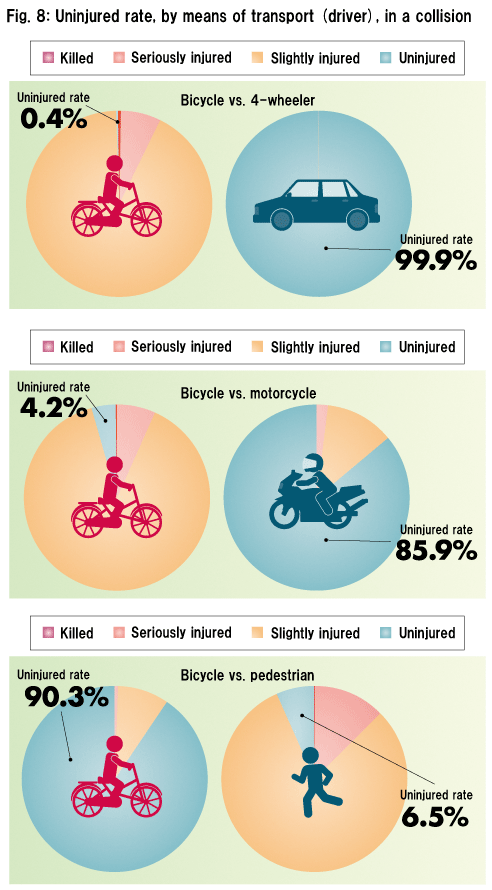
Figure 8 shows the degree of injuries received by cyclists in traffic accidents, as bicycles vs. other means of transport. The percentages shown are the proportion of those who escaped injury in an accident ("uninjured rate"). Needless to say, almost all (99.9%) drivers in a four-wheeled vehicle were uninjured after colliding with a bicycle, while almost all bicycle riders suffered injury or death (uninjured rate: 0.4%). Similarly, the uninjured rate for motorcycle riders after colliding with a bicycle is 85.9%, while that of bicycle riders is 4.2%. This means that bicycle riders are almost always victims in a collision with a vehicle bigger than a motorcycle, which is why they are called vulnerable road users.
When crashing into pedestrians, however, the bicycle becomes a one-sided attacker, as shown in Fig. 8, with the possibility of being the "perpetrator" in an accident.
Bicycle riders as victims when hit by a motor vehicle (excluding pedestrians) are analyzed in detail below, dividing them into operators and passengers. The accident data used is an aggregate of all accidents between 1990 and 2007 involving the primary/secondary parties riding a bicycle.
|
|
|
|
−Difference in damage between operator and passenger−
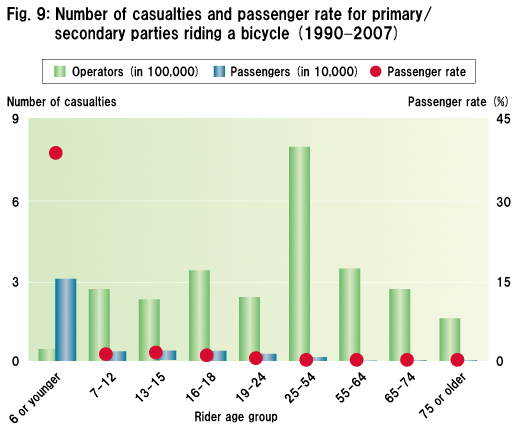
The number of those injured and killed during a bicycle ride is shown in Fig. 9 by age group for the operator and the passenger separately. The red marks indicate the proportion of passengers injured or killed among the total casualties ("passenger rate") in each age group. The passenger rate is calculated as follows:
Passenger rate (%) = Number of passengers ÷ (Number of operators + Number of passengers) × 100
|
|
|
|
The total number of casualties in the 18-year period (1990-2007) amounts to 2.7 million for operators and 50,000 for passengers, the latter accounting for as low as 1.8%. Of these 50,000 casualties, 63% are children 6 years old or younger, and 33% are those aged 7 to 24.
The age group "6 or younger" has a remarkably high passenger rate of 39%, whereas the rate is around 1.5% for the age groups 7-12, 13-15, 16-18 and 19-24. Students of these ages are often seen sharing a bicycle, but the rate proves to be quite low. There are very few fatalities in bicycle riders aged over 25 sharing a ride.
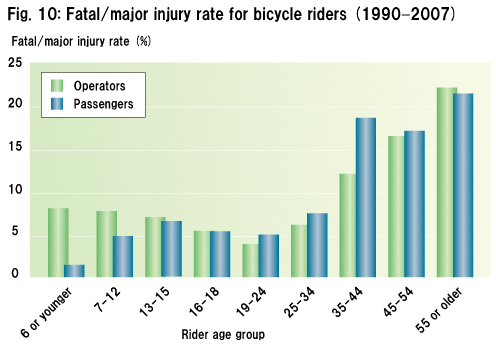
Who is exposed to greater danger, the operator or the passenger? As an indicator of the severity of damage to bicycle riders, Fig. 10 provides the fatal/major injury rate defined as follows:
Fatal/major injury rate (%) = (Number of deaths + Number of serious injuries) ÷ Number of casualties × 100
The fatal/major injury rate generally shows a similar trend for both operators and passengers, basically depending on the bodily impact resistance of each individual. However, the rate is significantly lower in children 12 years old or younger, particularly those under 7, when they are a passenger, compared to when they are operating the bicycle themselves. This is because, as explained later, they are more likely to be carried on a bicycle that is operated by an adult.
|
|
|
|
−Reason for high accident rates for bicycles carrying a passenger−
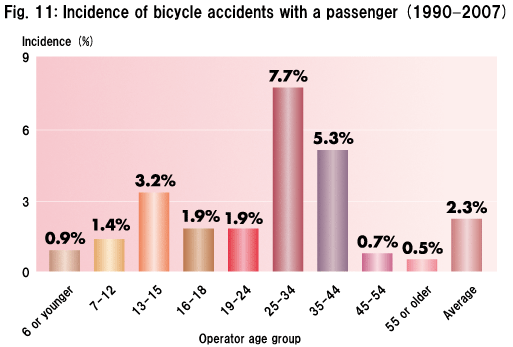
In which age groups do we find cyclists who frequently have a passenger on their bicycle? The incidence of traffic accidents involving a bicycle with a passenger is shown in Fig. 11, by age group of bicycle operators.
The rate is particularly high among the age groups 25-34 and 35-44, generations considered to be raising small children, as well as the age groups 13-15, 16-18 and 19-24 although not that much. Let's look more closely at the composition of operators and passengers.
|
|
|
|
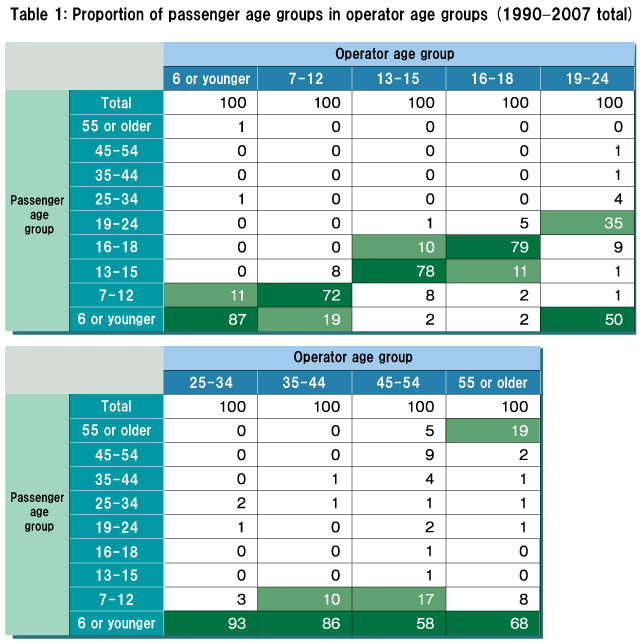
The proportion of passenger age groups at the time of an accident is listed in Table 1 for each operator age group, i.e., the figures add up to 100% in each operator age group. The dark green shading indicates the highest proportion in each operator age group, and the light green shading indicates the second highest that is more than 10%.
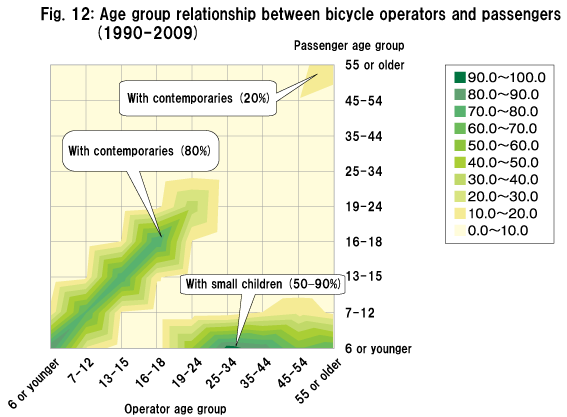
The data in Table 1 is expressed in Fig. 12 using contour lines, as used in a pressure distribution chart for a weather map, with the greener portion representing a higher possibility of a passenger being present in a particular age group.
It is revealed that in most of the cases (about 80%), children in the age groups 6 or younger, 7-12, 13-15 and 16-18 share a ride with those in the same age group as themselves, and adults over 25 tend to (50 to 93%) have small children aged under 7 as their companions on the bicycle. Also, about 20% of people aged over 45 ride a bicycle with a person in the same age group as themselves. Note that these figures are based only on data on bicycles involved in traffic accidents and therefore do not necessarily reflect the real situation of double-riding including bicycles not involved in traffic accidents.
|
|
|
|
−Risk when cycling with a passenger−
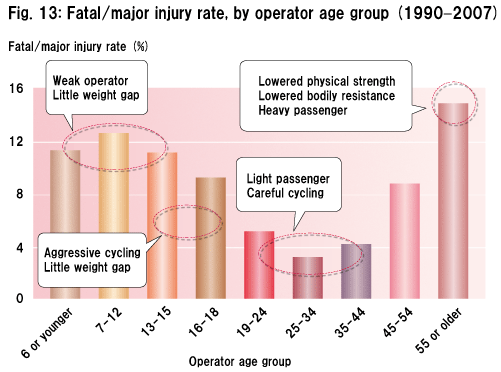
Figure 13 shows the fatal/major injury rate in bicycle accidents with a passenger, by age group of bicycle operators. Accident frequency data is needed for accurate analysis, but for the reason explained in Section 2, the fatal/major injury rate is used here instead. In bicycle-to-car accidents and bicycle-to-motorcycle accidents, in which the motor vehicle almost always causes severe damage to the bicycle, the one who suffers death or serious injury is most likely to be the bicycle rider.
|
|
|
|
The results shown in Fig. 13, together with the age group relationship between operators and passengers in Fig. 12,
can be summarized as follows. Note that the statement for small children 6 years old or younger should be regarded simply as a guide because of a lack of sufficient data to ensure reliability.
1. Operator age groups 6 or younger, 7-12 and 13-15 present high fatal/major injury rates because of a lack of physical strength and the little weight difference between the operator and the passenger, which tends to upset the stability of the bicycle.
2. Operator age groups 13-15 and 16-18 also present high fatal/major injury rates because of the little weight difference between the operator and the passenger and the aggressive manner of cycling.
3. On the contrary, operators over 19 years old have a lower possibility of suffering death or serious injury possibly because their companions are generally small children aged 12 years old or younger who put less weight load on the operator. Another factor may be the operator's effort to ride the bicycle more carefully for the sake of the child.
4. In the case of operators over 55 years old, the fatal/major injury rate rises again, presumably because of more frequent occasions when an adult is seated behind the operator, as well as decreased physical strength and bodily resistance to impact.
|
|
|
|
−Mothers with one/two children aged under 13 on bicycle−
The risk of riding double/triple with one/two children in the age groups 6 or younger and 7-12 is analyzed using data on the following scenarios:
* Accidents in which a female aged between 18 and 44 (assumed to have young children) was the operator of the bicycle involved,
* Accidents occurring between 6 and 11 in the morning and between 1 and 5 in the afternoon, and
* The above accidents categorized as no passengers, one passenger and two passengers aged under 13.
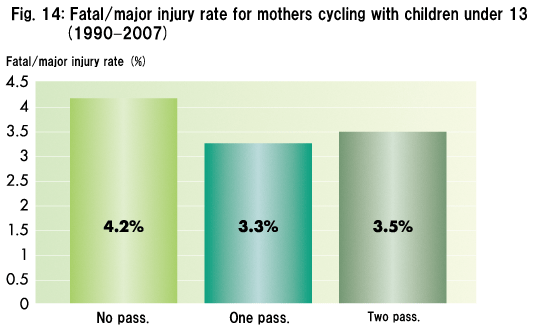
Accident frequency data must be used as an indicator, but for the reason explained in Section 2, the fatal/major injury rate among total accidents is used here.
The results are shown in Fig. 14. The fatal/major injury rate proves to be lower when young children under 13 years of age were carried on a bicycle compared to when mothers traveled alone. Note that the comparison of one/two passengers in Fig. 14 should be regarded simply as a guide because of a lack of sufficient data. In any case, it can reasonably be assumed that mothers who are cycling with their children make an effort to operate the bicycle more safely to avoid a major accident. In other words, major accidents can be avoided by careful cycling even under limited operability due to the presence of a passenger.
|
|
|
|
|
|
UP
Back Next
|
