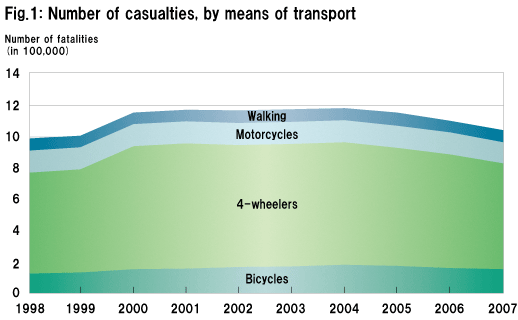
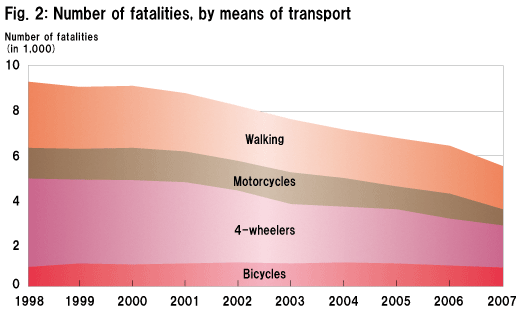
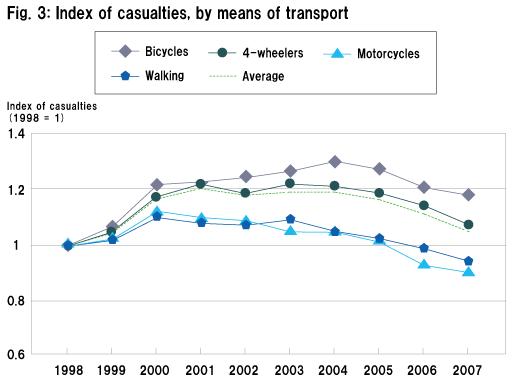
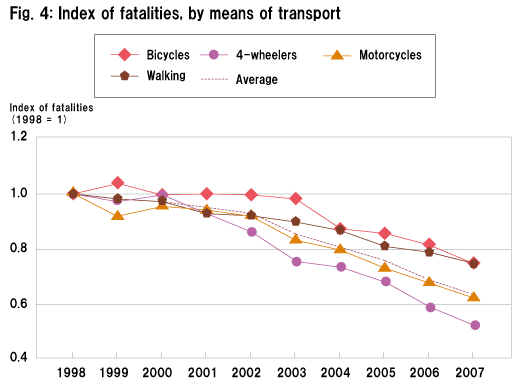
Figure 1 shows the number of casualties (total of minor injuries, serious injuries and deaths) in traffic accidents, by means of transport, and Fig. 2 shows the number of fatalities. For ease of comparison, indices of casualties/fatalities for the past ten years are shown in Figs. 3 and 4 for each means of transport, with the number in 1998 set to 1.
We can see that the slowest reduction trend is in bicycle rider casualties.
The general trend for each means of transport can be summarized as follows:
4-wheelers: Although the number of casualties as a whole has decreased only a little, the number of deaths has dropped dramatically. This is presumably because safety measures for four-wheeled vehicles have been successful, or major fatal accidents have decreased.
Motorcycles: Both casualties and fatalities are on the decrease, possibly because of a decrease, or only a slight increase, in the number of motorcycle riders.
Bicycles: Both casualties and fatalities show a relatively small decline, suggesting that the number of bicycle users has not decreased, or perhaps has even increased.
Walking: While there has been a significant reduction in casualties, the number of deaths has been decreasing fairly slowly just like in the case of bicycles. This is attributable to a growing number of elderly walkers, who are more likely to be killed when involved in a traffic accident.
|
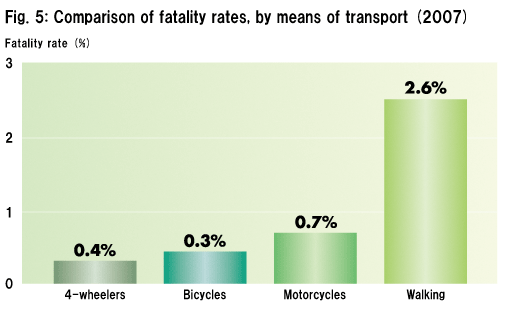
Some types of traffic accidents cause more fatalities than others. Figure 5 compares the fatality rates, defined as the proportion of deaths in the total casualties, of the four means of transport. The fatality rate is calculated as follows:
Fatality rate (%) = Number of deaths ÷ Number of casualties × 100
Pedestrians have a markedly high possibility of being killed in an accident, followed by motorcycles and bicycles at a much lower possibility, and, the safest of all, four-wheeled vehicles. Pedestrians and cyclists are both unprotected, but the difference in their fatality rate is considered to be due to a high percentage of young people among overall bicycle riders.
|