|
1) Degree of Injury
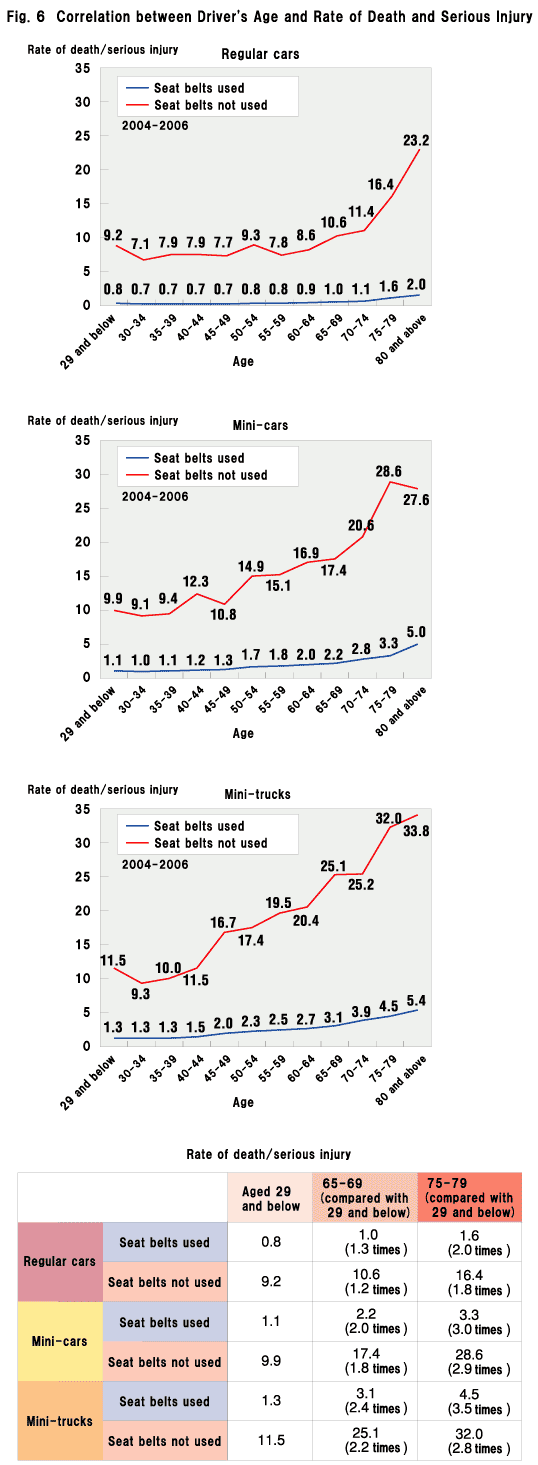
Figure 6 shows the correlation between the age of the driver and the percentage of drivers killed or seriously injured in traffic accidents. This was analyzed by type of four-wheeled vehicle (regular cars, mini-cars, and mini-trucks) and whether or not seatbelts were worn. The percentage of those killed or seriously injured is defined as below.
Percentage of drivers killed or seriously injured = (drivers killed + injured) / (drivers killed + seriously injured + slightly injured + not injured) × 100 (%)
Regardless of vehicle type and whether or not seat belts were used, more drivers tended to be killed or seriously hurt along with increase in age. The percentage of deaths or serious injury was 1.2-1.3 times greater for regular-car drivers aged 65-69 compared with drivers aged 29 and below, and 1.8-2.0 times more for those aged 75-79. Among drivers of mini-cars and mini-trucks, the ratio was 1.8-2.4 times for those aged 65-69 and 2.8-3.5 times for 75-79, showing the stronger influence of the driver's age. As mini-cars weigh less, they tend to sustain a greater impact in collisions, thus seriously injuring or killing elderly drivers, who have more fragile bones and weaker muscles, at a higher rate than regular cars. If seat belts are not used, car occupants are at high risk of crashing hard against car compartments, resulting in death or serious injury of more than 20% (one in five) of the drivers involved in accidents.
|
|
|
|

|
|
|
2) Body Parts Injured and Car Parts Causing Injury
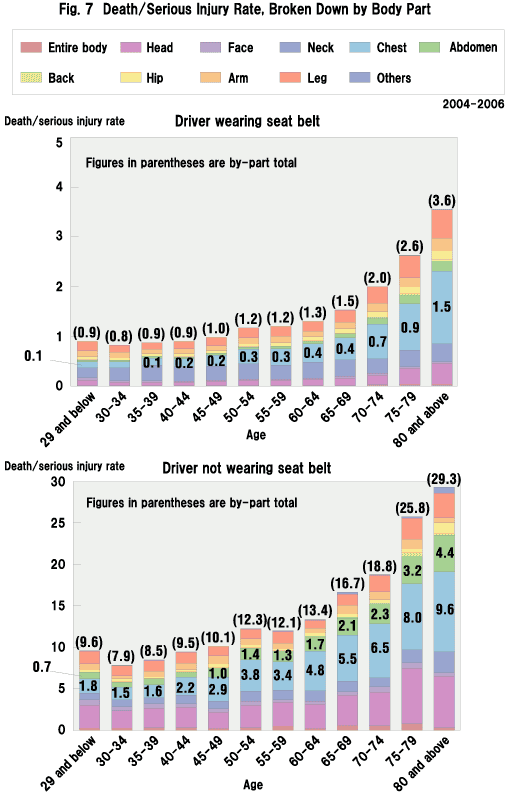
Analyzed next were injured body parts and car parts that caused injury. Figure 7 shows the breakdown of deaths and serious injuries shown in Fig. 6 by injured body part. The chart, incidentally, shows the total for regular cars, mini-cars, and mini-trucks. When seatbelts were worn, the death/serious injury rate for the 65-69 age group stood at 1.5%, approximately twice that of the 29-and-below age group (0.9%). However, the rate of chest injury (0.4%) was four times greater for those aged 65-69 than those 29 and below (0.1%). For the 75-79 age group, the death/serious injury rate was nearly three times that of the 29-and-below age group (2.6/0.9), whereas death and serious injury caused by chest damage was as high as nine times (0.9/0.1) greater, clearly indicating that older drivers tend to suffer chest injury in traffic accidents. When seat belts were not used, the death/serious injury rate due to chest damage stood three times higher for the 65-69 age group compared with the 29-and-below group (5.5/1.8), and about four times greater for the
75-79 age group (8.0/1.8). Abdominal injury incidence was also three times greater for 65-69 than 29-and-below (2.1/0.7) and five times for 75-79 (3.2/0.7). As expected, senior drivers not wearing seat belts are more likely to sustain injuries to the chest and abdomen.
|
|
|

|
|
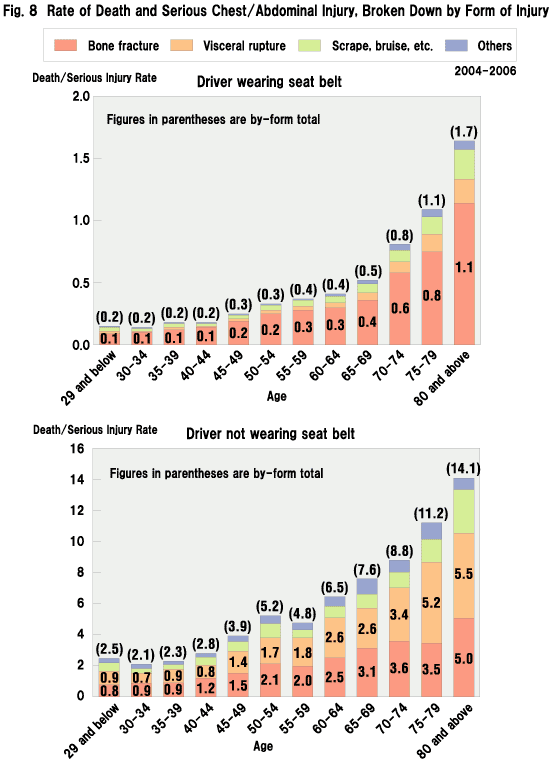
Form of injury was studied next. Figure 8 illustrates the death/serious injury breakdown of chest and abdominal injuries shown in Fig. 7 by the form of injury sustained. For seat belt users, injuries mainly took the form of bone fractures, with the 65-69 age group suffering such injury at a rate about four times greater than that in the 29-and-below age group (0.4/0.1), and the 75-79 age group eight times greater (0.8/0.1), indicating the likeliness of elderly drivers to suffer bone fractures in traffic accidents. When seat belts were not used, the 65-69 age group showed bone fractures four times as often as the 29-and-below age group (3.1/0.8), and visceral rupture nearly three times more frequently (5.2/0.9), while the 75-79 age group presented, respectively, four times (3.5/0.8) and six times (2.6/0.9) greater incidence rates. Elderly drivers not wearing seat belts not only suffer bone fractures but visceral rupture as well.
|
|
|

|
|
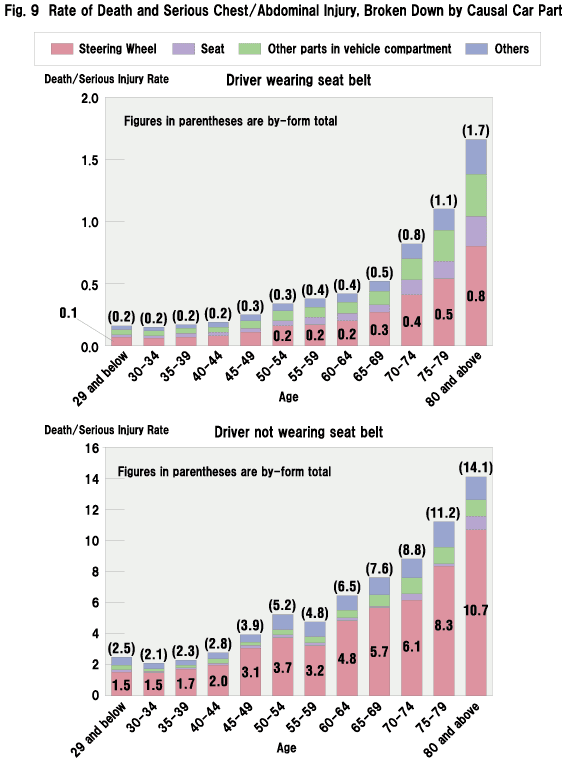
Figure 9 shows the parts of the car causing death or serious chest/abdominal injury. For seat belt users, injury from the steering wheel was three times more frequent for the 65-69 age group compared with the 29-and-below age group (0.3/0.1), and five times for the 75-79 age group (0.5/0.1). For those not wearing seat belts, injury from the steering wheel was about four times more frequent for those aged 65-69 (5.7/1.5), and around six times for those aged 75-79 (8.3/1.5), showing that age counts more than seat belts.
From these facts, it was found that elderly drivers characteristically suffer a higher rate of death and serious injury due to rib fractures and visceral ruptures sustained by crashing against the steering wheel. Weaker bones and muscles may be the cause. If the seat belt is not worn, a driver is more likely to hit hard against the steering wheel, and thus be killed or seriously hurt in an accident.
|
|
|

|
|
