
|
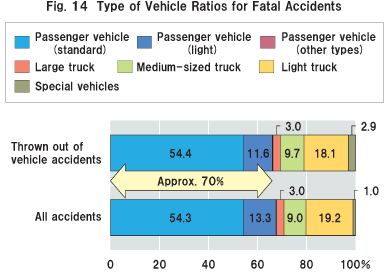
As a means of determining whether thrown out of vehicle fatalities are common to any particular type of vehicle, comparisons were conducted using the categories of "vehicles involved in thrown out of vehicle fatalities" and "vehicles involved in all fatalities" (see Fig. 14).
The results showed that 70 percent of thrown out of the vehicle accidents occur in standard passenger vehicles and light passenger vehicles. The next ranking vehicle type for this accident category was light trucks, which accounted for approximately 20 percent.
Comparison results showed that fatalities were not common to any one specific vehicle category. This indicates that "thrown out of vehicle fatalities" are not especially common to any one vehicle type.
|
|
|
|
|
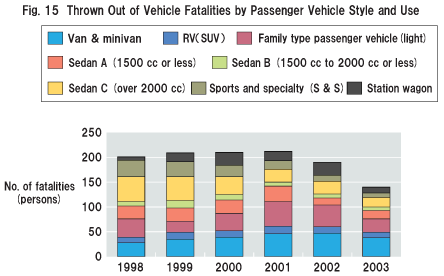
What Fig. 14 did show was that thrown out of vehicle fatalities are most prevalent with passenger cars. More detailed studies were conducted of fatalities according to passenger vehicle style and use (see Fig. 15).
Although fatality figures have decreased annually since 2001, figures for the van & minivan vehicles have remained constant for the past three years.
|
|
|
|
|
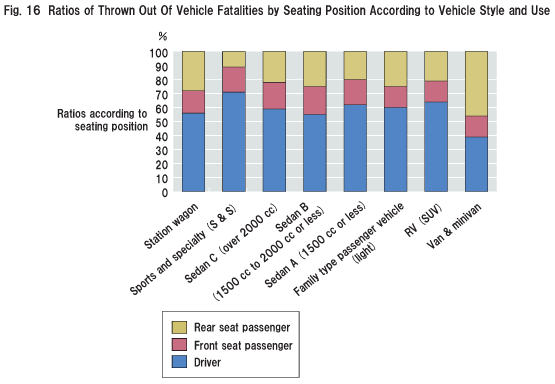
Fig. 16 shows comparisons between the van & minivan type passenger vehicles and other types according to fatality by seating position. The results reveal the very high ratio for rear seat passengers in the van & minivan type passenger vehicles.
|
|
|
|
|
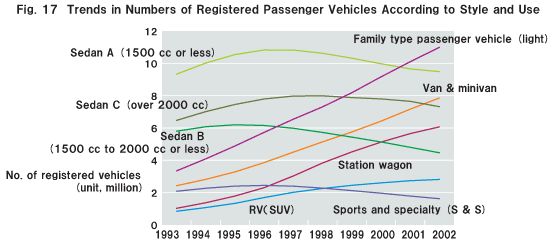
The figures for numbers of passenger vehicle registrations over the ten-year period from 1993 through 2002, as shown in Fig. 17, indicates a growth in the number of the van & minivan type passenger vehicles.
The van & minivan type vehicles are used for transporting larger groups such as family and friends. While it can be expected that this style of vehicle would produce more fatalities for passengers sitting in the rear seating area, the problem is also compounded by the fact that there is a very low rate of seatbelt in vans & minivan type vehicles.
If this trend continues, we believe there is a danger that casualties involving passengers seated in the rear areas out of the van & minivan and station wagon type passenger vehicles will continue to increase.
A study to determine the collision impact locations on the vehicle body that produce the highest ratios of passengers being thrown out of the vehicle identified the right front and left front areas. We surmise that impact applied to those locations have as the effect of spinning the vehicle around or bouncing it away, with the resulting force of the impact throwing the passengers out.
|
|
|
|
|
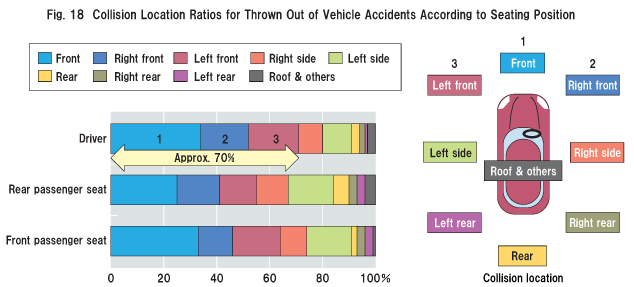
And as shown Fig. 18, information in the relationship between "passenger seating position" and "location of collision impact" on vehicles that throw out passengers reveals that drivers are thrown out in 70 percent of cases by head-on collisions. In contrast, both front and rear seat passengers were most frequently thrown out of vehicle by collisions to the side areas of the vehicle body.
|
|
|
|
|
|
UP
Next
|
