
|
A study was conducted over the five-year period from 1998 through 2002 to determine the types of accidents that throw people from vehicles. Extraction of information on such accidents from the macro data (Comprehensive Database on Traffic Accidents) for the period revealed that there were 5,034 such accidents.
For comparison purposes, statistics were also included on the "number of all fatal accidents" and the "number of all accidents."
Figures for the number of all fatal accidents and the number of all accidents were taken from the traffic statistics edition for 2003.
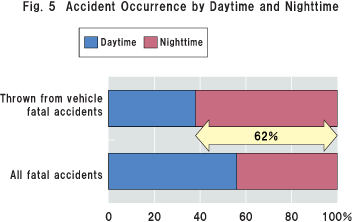
We also examined whether fatalities for thrown out of vehicle accidents are higher during the daytime or nighttime (see Fig. 5). The figures revealed that fatalities at night comprised 62 percent, which is significantly higher than the 44 percent figure for nighttime fatalities for the "all fatal traffic accidents" category.
|
|
|
|
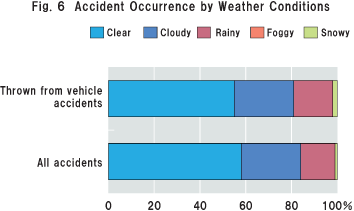
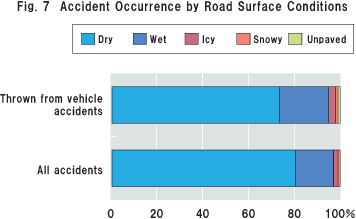
Statistics for the number of accident fatalities among thrown out of vehicle accidents according to weather conditions (Fig. 6) and road surface conditions (Fig. 7) revealed slightly higher statistics for "rainy weather" and for "wet surface" conditions than for all accidents.
|
|
|
|
|
|
|
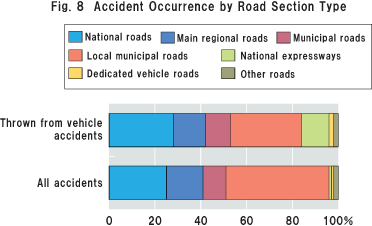
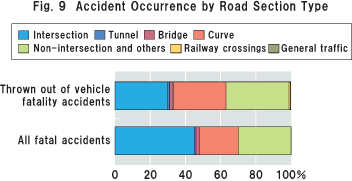
Statistics according to "type of road" (Fig. 8) showed higher fatalities rates for "expressways" and those for "road section type" (Fig. 9) showed higher fatalities for road sections other than intersections.
|
|
|
|
|
|
|
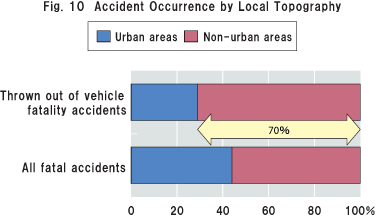
Figures for fatality rates according to "local topography" (Fig. 10) showed very high rates of 70 percent for "non-urban areas."
|
|
|
|
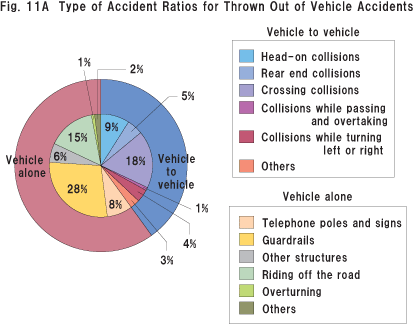
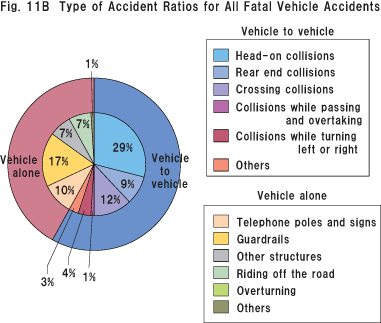
Next, as shown in Fig. 11A and 11B, fatalities from thrown out the vehicle accidents and all fatal accidents were categorized according to "type of accident." In the case of fatalities from thrown out of vehicle accidents, the "vehicle alone" figure was higher than that for all fatal accidents. The highest figure for the "vehicle alone" figure was for the "collisions with guardrail" category with 28 percent. The next highest category was vehicle to vehicle "crossing collisions," with 18 percent.
|
|
|
|
|
|
|
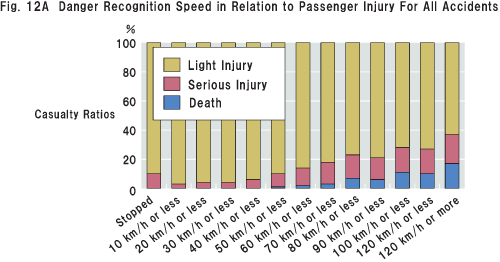
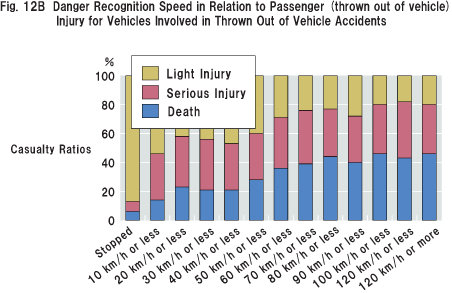
The point of the vehicle speed at which drivers involved in accidents were aware that they were going to collide is referred to as the "danger recognition speed." Fig. 12A and 12B compare the types of casualties (light injury, serious injury, death) suffered according to level of "danger recognition speed" for the categories "all vehicles involved in accidents" and "vehicles involved in thrown out of vehicle accidents."
|
|
|
|
|
|
|
|
UP
Next
|
