 |
||||
|
||||||||

|
| Deaths resulting from traffic accidents peaked in 1992 at 11,451 deaths during the year, and have continued to decline ever since. In 2003, the figure was 7,702 deaths, approximately 67% of that in 1992. This decline, however, was primarily due to the decrease in the deaths of the young and the middle-aged, as seen in Fig. 1. In contrast, traffic accident deaths of seniors have increased about 4% during the same period. |
|
|

|
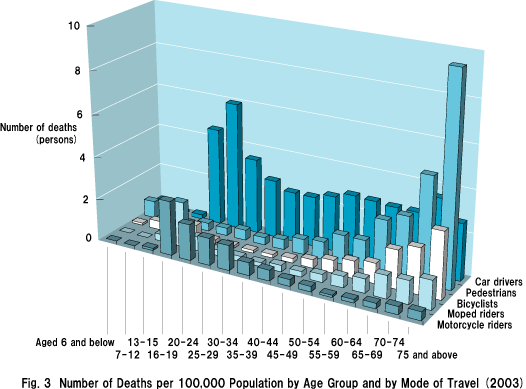
| Figure 2 shows traffic accident deaths per 100,000 population in each age group, with a significant difference in death rates among age groups. The number of deaths per 100,000 population is particularly high among seniors. The elderly, aged 75 and more, shows the highest number of deaths per 100,000 population, about 4.6 times that of the 35-39 age group which has the lowest number of those above the age of 16. Breaking down traffic accident deaths per 100,000 population by age groups and by mode of travel (whether in four-wheeled vehicle, on foot, on bicycle, etc.), the higher the accident victims' ages are, the greater the ratio of those who were either on foot or on bicycle when the accidents occurred, as evidenced in Fig. 3. These two types of accident deaths are analyzed below. |
|
|
|
|
|
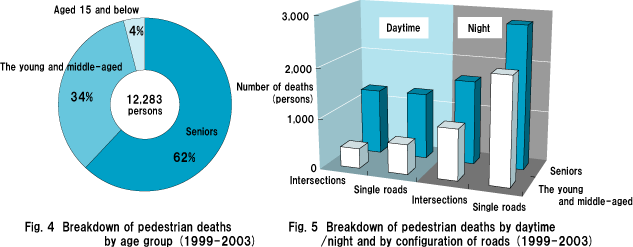
| (1)Deaths at Intersections and Single Roads Pedestrian deaths during the five years from 1999 through 2003 totaled 12,283. Of these, seniors accounted for 62%, whereas the young and the middle-aged accounted for 34%, hence seniors' deaths numbered 1.8 times those of the young/middle-aged (Fig. 4). Examining pedestrian deaths involving cars in relation to the configuration of roads, and to daytime/night category, as shown in Fig. 5, both seniors and young/middle-aged pedestrians tend to meet fatal accidents at single roads more frequently than at intersections. By daytime and night, more traffic accident deaths occur at night among both seniors and the young/middle-aged. In particular, a significant number of senior pedestrians die in traffic accidents at single roads at night. |
|
|
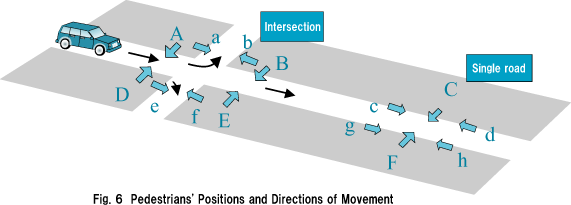
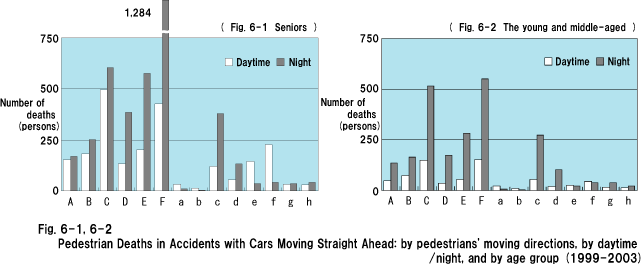
| (2)Direction of Movement Figure 6 indicates directions of movement of cars and pedestrians at the time of accidents, both at intersections and single roads. Comparisons of daytime/night accidents by age group are shown in Figs. 6-1 and 6-2. |
|
|
| In the case of senior pedestrians, 68% of fatal accidents occurred between cars going straight ahead and pedestrians trying to cross roads, of which 40% took place on single roads. The remaining 28% occurred at intersections and places other than single roads. As for young/middle-aged pedestrians trying to cross roads, accidents with cars going straight accounted for 57% of all fatal accidents, of which 33% happened at single roads. These tendencies are about the same for daytime accidents and for nighttime accidents. Regarding the directions from which senior pedestrians were trying to cross roads, the number of those who were walking across from the right-hand direction of the drivers (expressed as D, E and F in Fig. 6) totaled 1.6 times of those who were crossing from the left-hand direction. The ratio was 1.2 times for young/middle-aged pedestrians. By daytime and night, daytime fatal accidents occurred 1.1 times more frequently when pedestrians, both seniors and younger people, were crossing from the left-hand direction of the drivers as compared with the right-hand direction, whereas the ratio was reversed in nighttime accidents, where pedestrian victims were crossing from the right-hand direction 2.2 times more often for seniors and 1.2 times more often for the young and the middle-aged. |
|
|
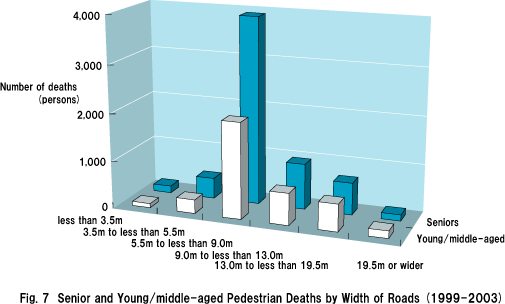
| (3)Pedestrian Deaths and Road Width Figure 7 shows an analysis of pedestrian deaths in traffic accidents by the width of roads where accidents took place. In both seniors and young/middle-aged pedestrians, the greatest number met fatal accidents at roads of 5.5-9.0m width, accounting for 63% of all senior pedestrian deaths, and 53% of all young/middle-aged pedestrian deaths. |
|
|
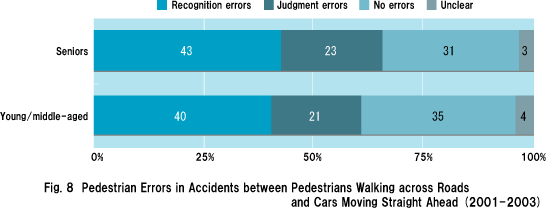
| (4)Pedestrians Errors Pedestrians go through three steps when crossing a road: recognition, judgment, and action. "Recognition" is the step of becoming aware whether a vehicle or vehicles are approaching or not, followed by the "judgment" step in which the pedestrian judges how an approaching vehicle is moving and what to do, and finally an "action" step where the person acts based on the judgment. Figure 8 indicates pedestrians' errors in recognition and judgment. Recognition errors account for 43% of fatal pedestrian accidents of seniors and 40% of the young/middle-aged, followed by judgment errors: 23% for seniors and 21% for the young/middle-aged, respectively. |
|
|
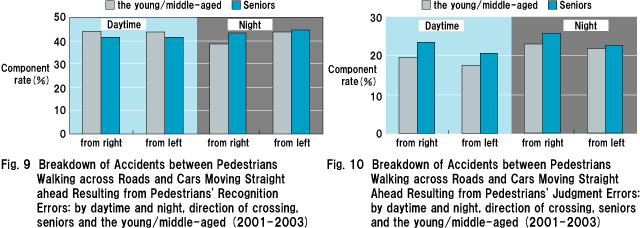
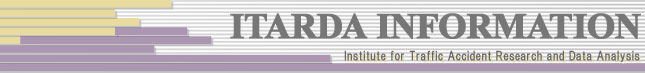
| Various circumstances in which recognition errors occurred were broken down by daytime and night, direction of crossing, and the young/middle-aged and seniors as shown in Fig. 9. There were few identifiable differences in circumstances where recognition errors occurred, such as crossing from the right-hand or left-hand direction of drivers, or daytime or night, between seniors and the young/middle-aged. But accidents due to recognition errors of senior pedestrians were somewhat fewer than those of the young/middle-aged during the daytime, and slightly greater at night, regardless of direction. Judgment errors were likewise compared as shown in Fig. 10. Tendencies were approximately the same for seniors and for the young/middle-aged. However, pedestrians crossing roads from the right-hand direction of drivers accounted for a greater portion of fatal accidents due to pedestrians' judgment errors, compared with those crossing from the left. In both directions, more accidents due to judgment errors took place at night than in the daytime. In either circumstance, however, judgment errors occurred more frequently among seniors than among the young/middle-aged. |
|
|
| UP |
Institute for Traffic Accident Research and Data Analysis (ITARDA) |