 |
||||
|
||||||||

|
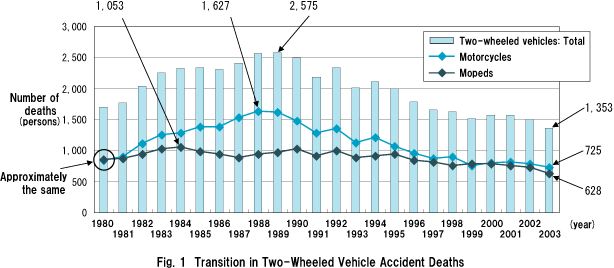
| Figure 1 shows the number of traffic accident deaths among two-wheeled vehicle riders since 1980. People who died in traffic accidents while riding two-wheeled vehicles with engine displacement of 50cc or more (hereinafter, motorcycles) peaked in 1988 with 1,627 deaths, and then gradually declined to 725, less than 45% of the peak year. Deaths of those riding two-wheeled vehicles of less than 50cc engine displacement (hereinafter, mopeds) also fell from the peak of 1,053 in 1984 to 60% in 2003 at 628. |
|
|
| The analysis follows, taking into account the difference between motorcycles and mopeds |

|
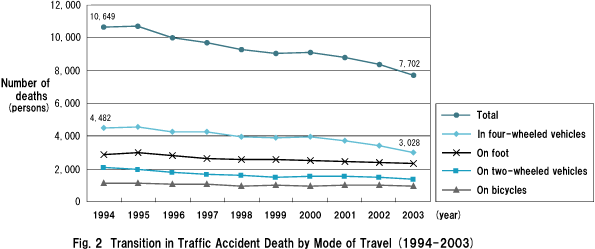
| Figure 2 shows the change in the mode of travel (whether by vehicle or on foot) when traffic accident deaths occurred. As seen in the graph, the number of deaths fell in every category. Deaths while traveling in four-wheeled vehicles showed the largest decrease. |
|
|
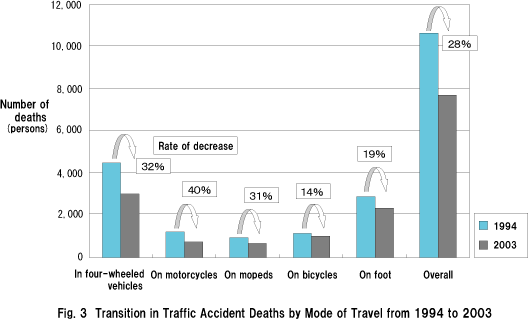
| Figure 3 compares the rate of decline in traffic accident deaths from 1994 to 2003. The rate of decrease was greater for those on two-wheeled vehicles than the overall drop: 40% for motorcycle riders and 31% for moped riders as compared to 28% for overall. |
|
|

|
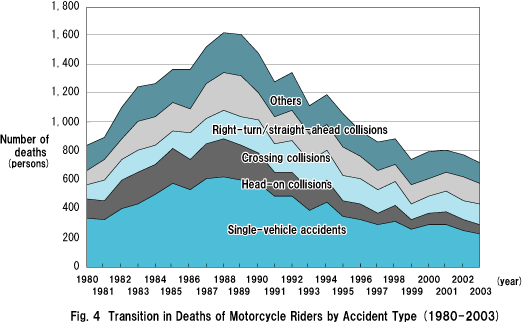
| Figure 4 indicates the shift of traffic deaths of motorcycle riders by accident type from 1980 to 2003. The breakdown of accidents around the peak year of 1988 shows greater ratios of single-vehicle accidents and head-on collisions. The primary cause was speeding. From around 1989, however, the ratios of single-vehicle accidents and head-on collisions show marked declines. Along with the decrease of two-wheeled vehicle accidents in general, the ratio of each accident type has become more or less identical. |
|
|
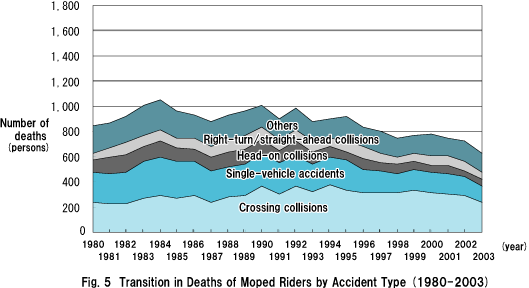
| Figure 5 indicates the shift in number of deaths of moped riders by accident type. The rise in overall deaths in the late 1980s is primarily due to the increase in single-moped accidents. The number has been on the decline since around 1989. Crossing collisions increased in 1990s, but have fallen in recent years. |
|
|
| Note: Statistics of right-turn/straight-ahead collisions are from 1995 onward. Before that, they had been counted as a type of right-turn accidents. Here, deaths by right-turn accidents up to 1994 and by right-turn/straight-ahead collisions are shown combined in the graph. |

|
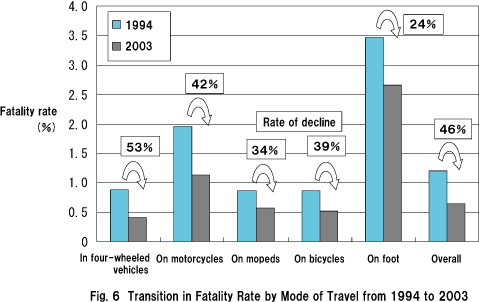
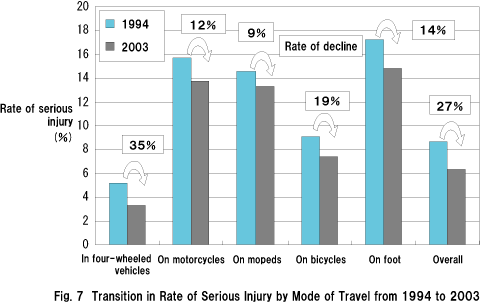
| Note: Fatality rate = deaths/casualties, Rate of serious injury = seriously injured/casualties |
| Figure 6 compares the rate of fatality by mode of travel in 1994 and 2003. In all modes, the fatality rate fell 46% during this period, while the fatality rate of four-wheel vehicle drivers/passengers declined 53%, that of motorcycle riders dropped 42% and that of moped riders 34%. On the other hand, the decline in the rate of serious injury for motorcycle and moped riders, at 12% and 9%, respectively, was not so large as the 27% decline in the rate for all serious traffic accident injuries and the 35% decline for four-wheeled vehicles drivers/passengers (Fig. 7). |
|
|
|
|
| UP |
Institute for Traffic Accident Research and Data Analysis (ITARDA) |