 |
||||
|
|||||||
 |
| 1.1 Yearly increases in parked vehicle accidents The number of personal injury accidents involving parked vehicles was 2,574 in 1998, 2,705 in 1999, and 2,878 in 2000 (11% increase over 1998), showing a tendency to increase yearly (Fig. 1). |
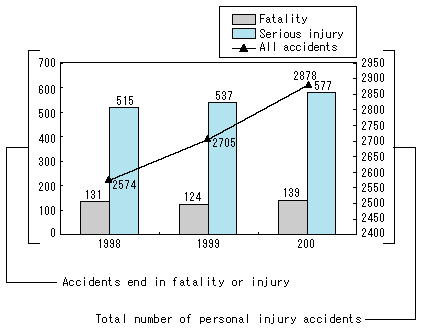 Fig. 1 Numbers of parked car accidents |
| 1.2 Parked vehicle accident fatality rate remarkably high Of the parked vehicle accidents in 2000, 139, or 4.8% ended in a fatality. That's more than 5 times the fatality rate of all accidents that end in personal injury, which is 0.93% (Fig. 2). |
 Fig. 2 Types of parked vehicle accidents |
| 1.3 Many of parked vehicle accidents involve moped 1st class and ordinary passenger car Our study revealed that 1,087 of the total 2,878 parked vehicle accidents involved an ordinary passenger car, 744 involved a moped 1st class, and together these accounted for roughly 64% of all the parked vehicle accidents. The number involving ordinary passenger cars was the largest, but when looking at the accidents by their causes (1st parties), which were 0.21% and 1.63% respectively for passenger cars and moped 1st class, we saw that a higher percentage were caused by moped 1st class (Fig. 3). |
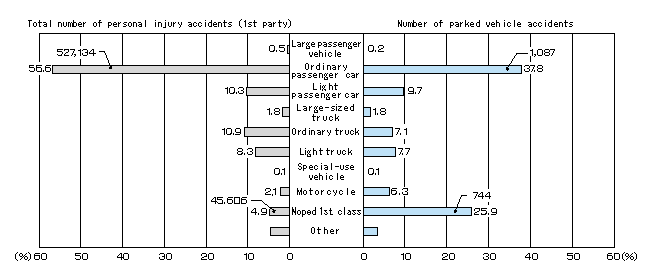 Fig. 3 Parties to parked vehicle accidents and percentage, out of all personal injury accidents, caused by each 1st party type |
| 1.4 Most collisions involve young drivers The line graph in Fig. 4 shows the number of parked vehicle accidents involving different age ranges - 508 for those 20-24, 405 for those 16-19, 376 for those 25-29, 262 for those 30-34 - revealing that one-third involved persons in younger age ranges. The line graph in Fig. 4 shows that of the parked vehicle accidents ending in a fatality, 21 ended in a fatality in the 25-29 age range, 105 ended in serious injury in the 16-19 age range, and the 508, the highest number, ended in personal injury in the 20-24 age range. |
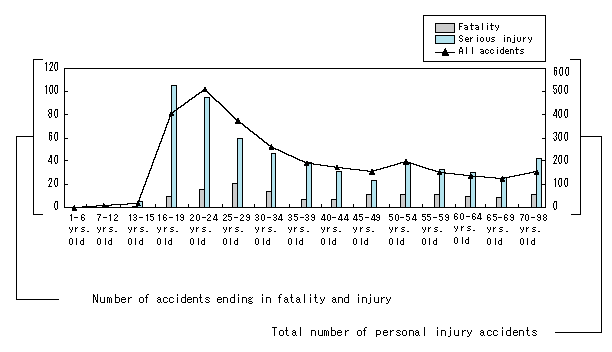 Fig. 4 Numbers of parked vehicle accidents by age range |
| 1.5 80% of parked vehicle accidents fatalities occur at night Fig. 5 shows the percentage of parked vehicle accidents by day and night. 1,821 occurred at night, and 1,057 occurred during the day. Approximately 63% happened at night. |
 Fig. 5 Percentage of parked vehicle accidents by night and day |
| In Fig. 6, showing the fatality rates of parked vehicle accidents by night and day, 113, or roughly 81% out of 139 accidents occurred during the night. This figure becomes even larger when compared with all fatal accidents, in Fig. 7. |
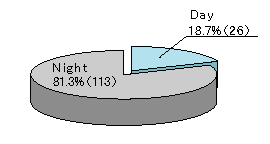 Fig. 6 Fatality rates of parked vehicle accidents by night and day |
 Fig. 7 Percentage of all fatal accidents by night and day |
| In Fig. 8, showing the percentage of serious injury from parked vehicle accidents by night and day, 383, or roughly 66%, of the 577 serious injury accidents occurred at night, which is roughly twice the percentage of all serious injury accidents at night shown in Fig. 9. |
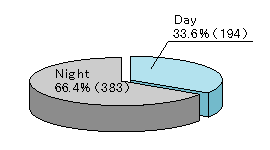 Fig. 8 Percentage of serious injury from parked vehicle accidents by night and day |
 Fig. 9 Percentage of all serious injury accidents by night and day |
| 1.6 70% of parked vehicle accidents occur on roads other than intersection 2,051 of all parked vehicle accidents occurred on roads other than intersection, 243 on curved sections of a road, 193 near an intersection, in order of prevalence, and accidents on roads other than intersection accounted for roughly 71% of the whole. Among these three, however, accidents near intersections accounted for the highest fatality rate (10.9%), followed by those on curved sections of roads (6.6%), and those on ordinary single-lane roads (4.6%). (Fig. 10). |
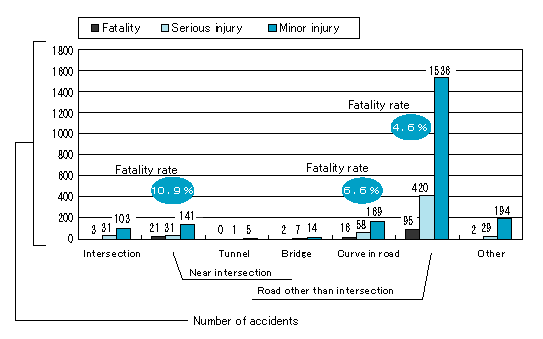 Fig. 10 Number of parked vehicle accidents by road type |
| 1.7 Fatality rate of most accidents on roads 9m and wider is high Parked accidents that occurred on roads of 5.5 to 9 meters in width were highest in both the percentage of the total and among the these accidents ending in fatalities, being approximately 51% of the total and 46% of fatal accidents, showing that the fatal accident ratio is even lower than ratio of the total. However, accidents on roads of 9 m or over show a higher fatality ratio than a ratio to the whole (Fig. 11). |
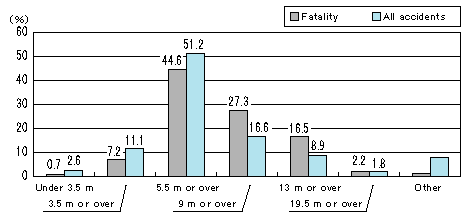 Fig. 11 Parked vehicle accidents by road width |
| 1.8 Kanagawa Prefecture, in particular, has the highest number of parked vehicle accidents As shown in Fig. 12, the prefectures with the highest numbers of parked vehicle accidents, in order, were Kanagawa with 446, Aichi with 191, Ibaraki with 166. Kanagawa had the highest percentage, or roughly 15% of the whole. |
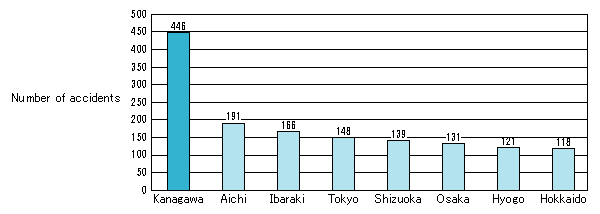 Fig. 12 Parked vehicle accidents by prefectures with 100 or more such accidents |
| UP |
Institute for Traffic Accident Research and Data Analysis (ITARDA) |