 |
||||
|
|||||||
| 3. Causes of fatal accidents during rainfall |
| Here we introduce the results of analyzing the number of fatal accidents according to vehicle/accident type (parties of the 1st and 2nd
part *3) and the number of fatal accidents according to the types of legal violations committed by the vehicle driver (as the 1st party)
and the pedestrian (as the 1st party). Figure 2 shows the number of fatalities per hour according to different conditions, including whether it is
raining. Vehicle drivers have a 1.67 times greater chance of having a traffic accident in the rain than when no rain is falling, whereas pedestrians have only a 1.09 times greater chance of having a fatal accident when it is raining. At the same time, the number of fatal accidents involving motorcycles and bicycles has been decreasing. This may be because of the decreasing number of people who use these methods of transportation when it is raining. |
Fig. 2 Number of fatalities per vehicle type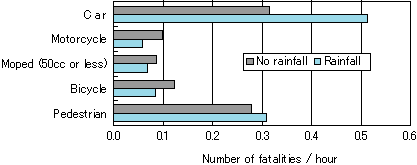 Chart 2. Comparison of fatalities per hour during rainfall and no rainfall by vehicle type 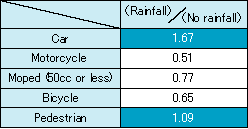 |
| Figure 3 shows the number of fatalities per hour during rainfall and no rainfall by accident type. The likelihood of having a single-car structural collision rose 1.88 times during rainfall as opposed to periods with no rainfall. The likelihood of two car head-on collisions rose 1.53 times during rainfall. The likelihood of fatalities involving vehicles and pedestrians within pedestrian crossing zones increased 1.31 times during rainfall. |
Fig. 3. Number of fatalities per hour by accident type 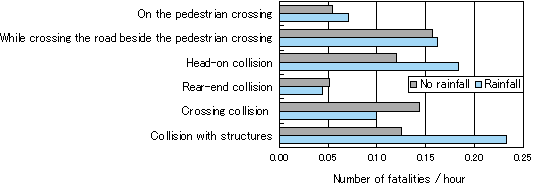 Chart 3. Comparison of fatalities per hour during rainfall and no rainfall by accident type 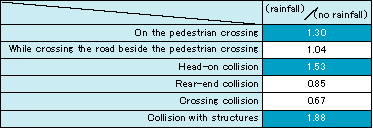 |
| Figure 4 shows the number of fatal accidents per hour by vehicle driver (1st party) legal violation type, during periods of rainfall and no rainfall. During rainfall, the likelihood of fatal accidents caused by violating the speed limit rose 1.81 times, by violating safe driving responsibilities and being inattentive to the vehicle ahead rose 1.2 times, and by improper driving rose 1.69 times. |
Fig. 4. Number of fatal accidents per hour by violation type 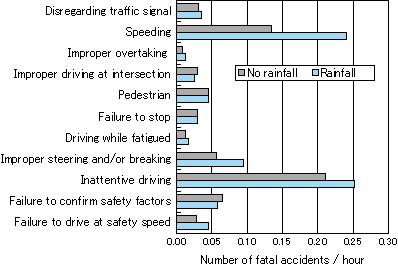 Chart 4. Comparison of fatalities per hour during rainfall and no rainfall by violation type 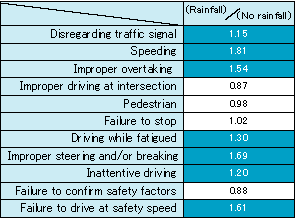 |
|
|
| 4. Time periods with many fatal accidents during rainfall |
| Figure 5 shows the number of fatal accidents per hour by time period, during periods of rainfall and no rainfall. There are an increasingly greater number of fatal accidents occurring at the time periods of 1:00a.m.-2:00 a.m. and 5:00 p.m.-2:00 a.m. |
Fig. 5. Number of fatal accidents per hour by time period 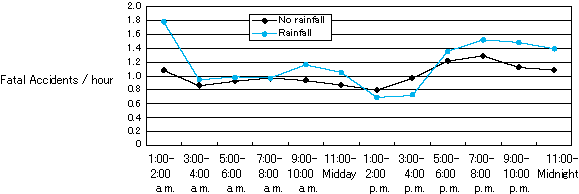 |
| UP |
|
Institute for Traffic Accident Research and Data Analysis (ITARDA) |