| 1. Significance of using AMEDAS (Automated Meteorological Data Acquisition System) data |
| By integrating AMEDAS data one-on-one with traffic accident data, we were able to calculate the number of accidents per unit time during
periods of rainfall/no rainfall and analyze the factors contributing to the frequency of these accidents.
If we look at the average number of traffic accidents in a certain town during one day, there would be 6 accidents during periods of no
rainfall and 4 accidents during periods of rainfall. By integrating AMEDAS data one-on-one with data for each accident, we can understand
the time lengths of rainfall/no rainfall during the day of the accidents. For instance, if we calculate that the period of no rainfall lasted
16 hours and the rainfall lasted 8 hours, then the number of accidents per hour during no rainfall was 0.37 times/hour, the accidents
during rainfall was 0.50 times/hour, and we can see that there is a higher rate of accidents during rainfall than during no rainfall.
Conventional data allowed the gathering of statistics on the number of accidents during periods of different weather, but since it
could not be used to calculate the length of time for each different type of weather, it could not be used to analyze the causes or
the number of accidents per hour during different weather conditions. |
|
| 2. Number of fatal accidents during rainfall |
Chart 1 shows a breakdown of the 8,797 fatal traffic accidents in 1998 by periods of rainfall and no rainfall, as well as average number of hours
observed for these periods and the number of fatal accidents per hour during these periods (data from 843 AMEDAS observation points
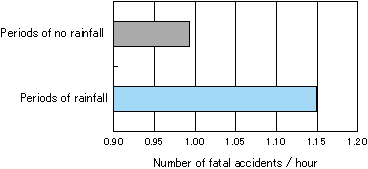
nationwide was used in this analysis). Figure 1 shows the number of fatal accidents per hour during periods of rainfall and no rainfall. There were
an average of 0.99 fatal accidents per hour during no rainfall and 1.15 accidents during rainfall, increasing probability of a fatal accident
during rainfall 1.16 times higher.
If, as the result of safety measures, the probability of fatal accident per hour during rainfall could be reduced to equal that of period of no rain,
then such accidents could be reduced by approximately 120 incidents. |
Chart 1 1998 Fatal accidents by periods of rainfall and no rainfall
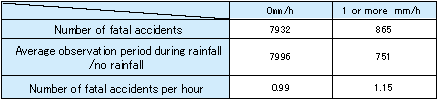
Fig. 1 Number of fatal accidents by periods of rainfall and no rainfall
 |